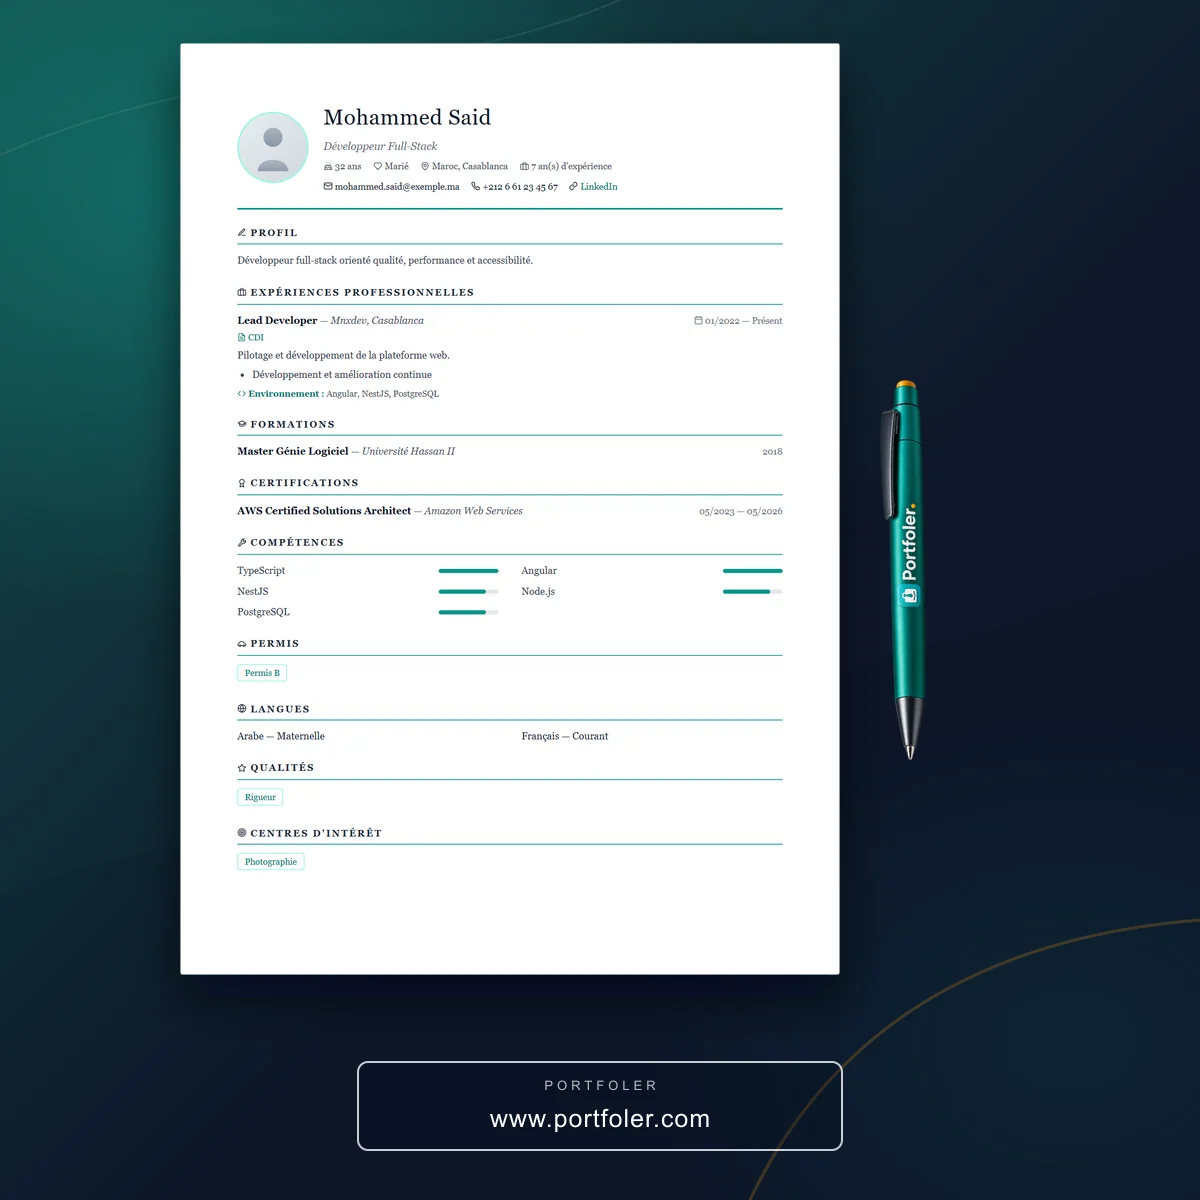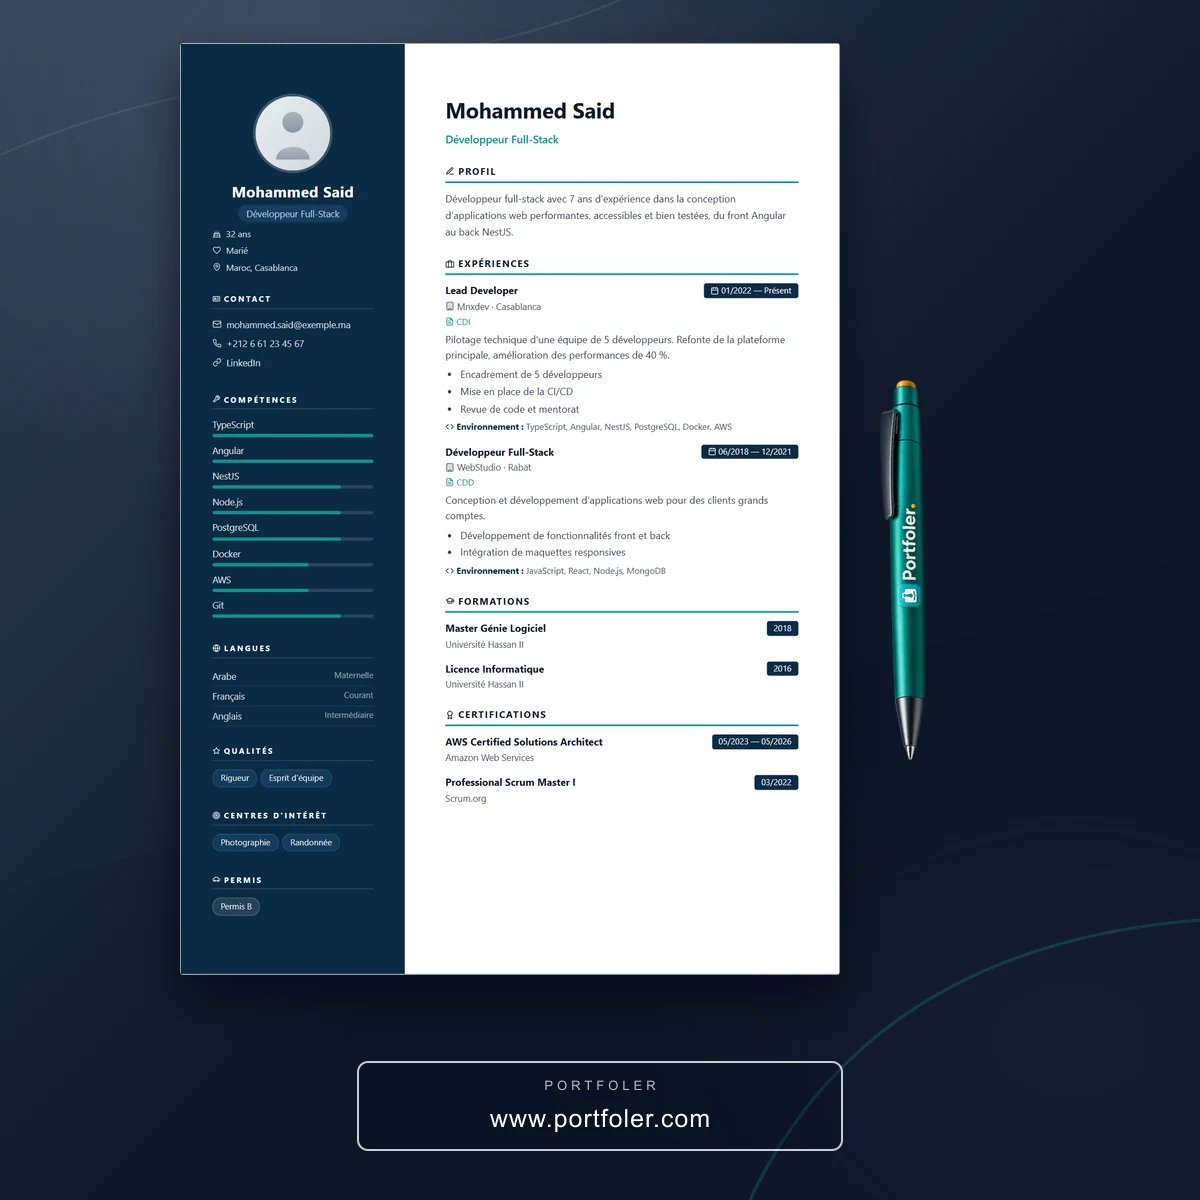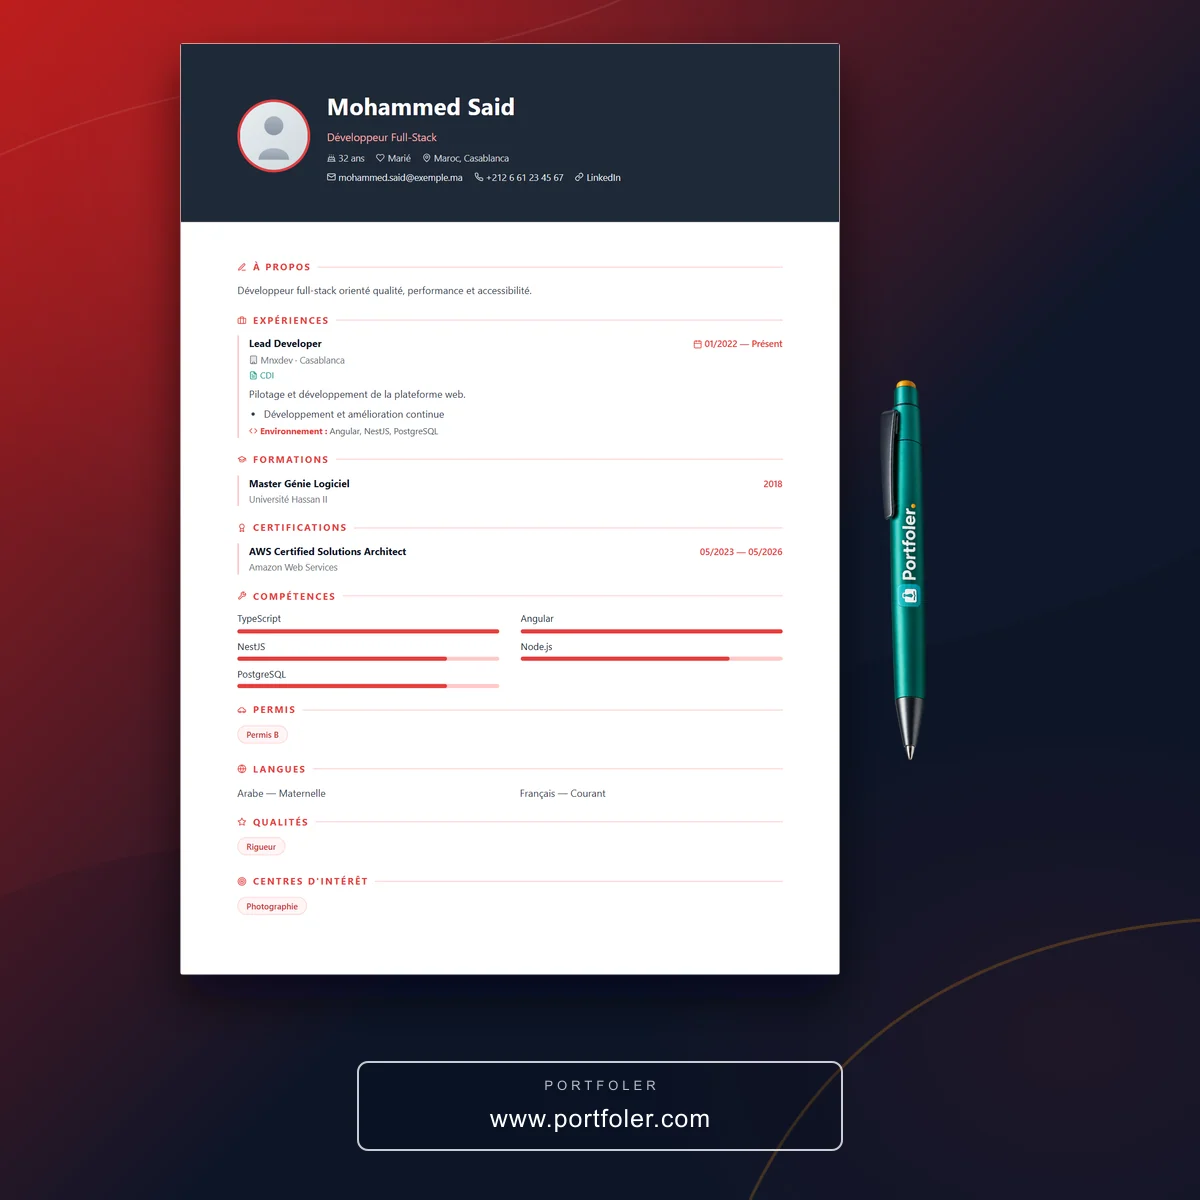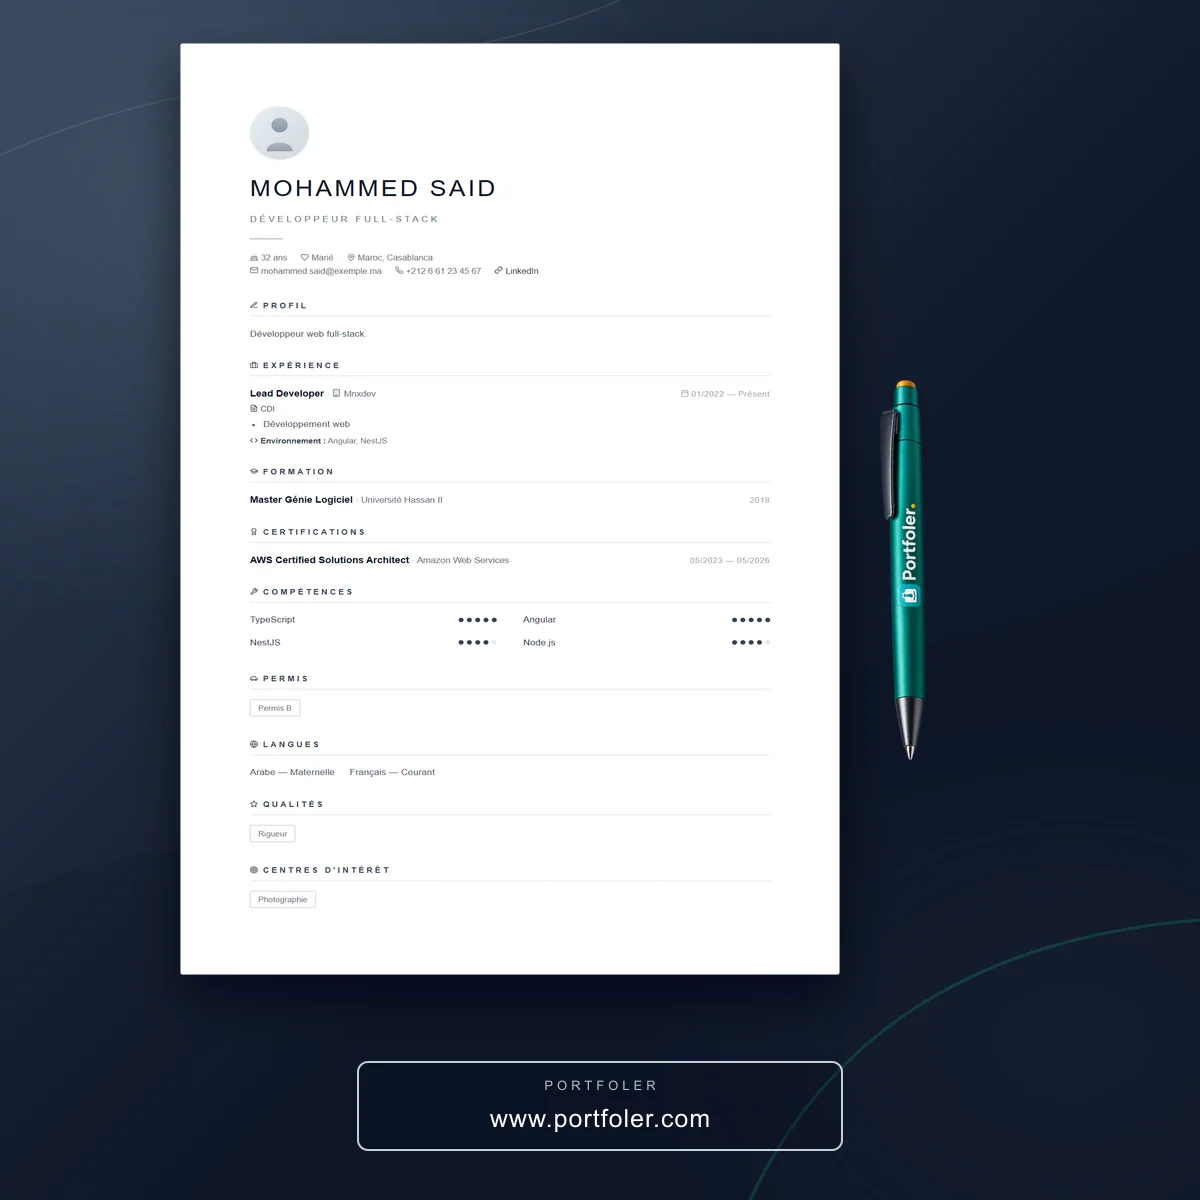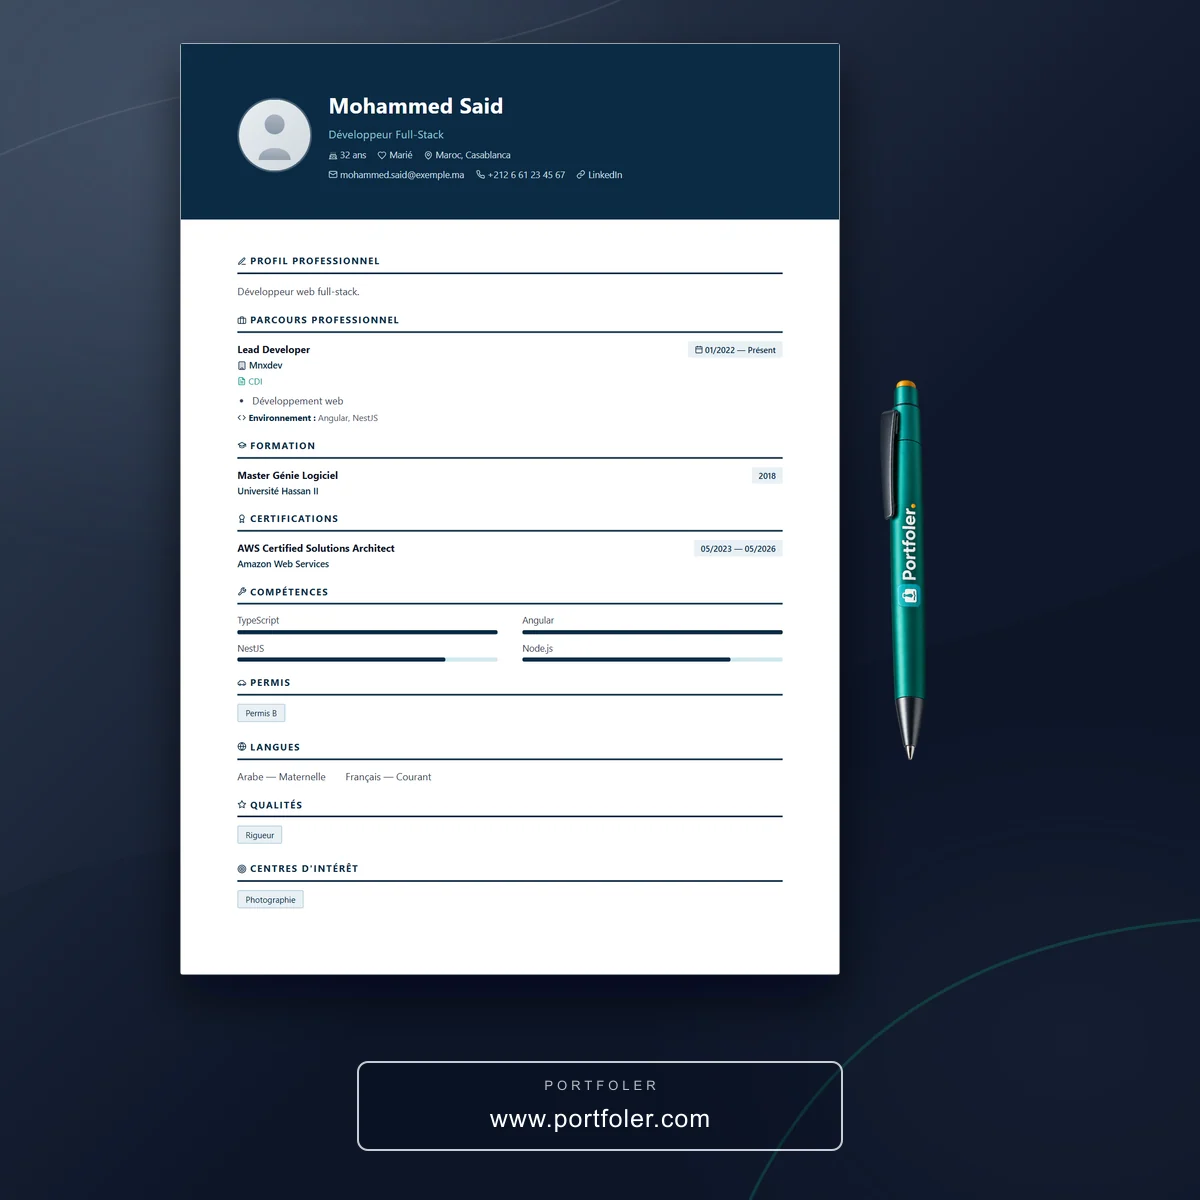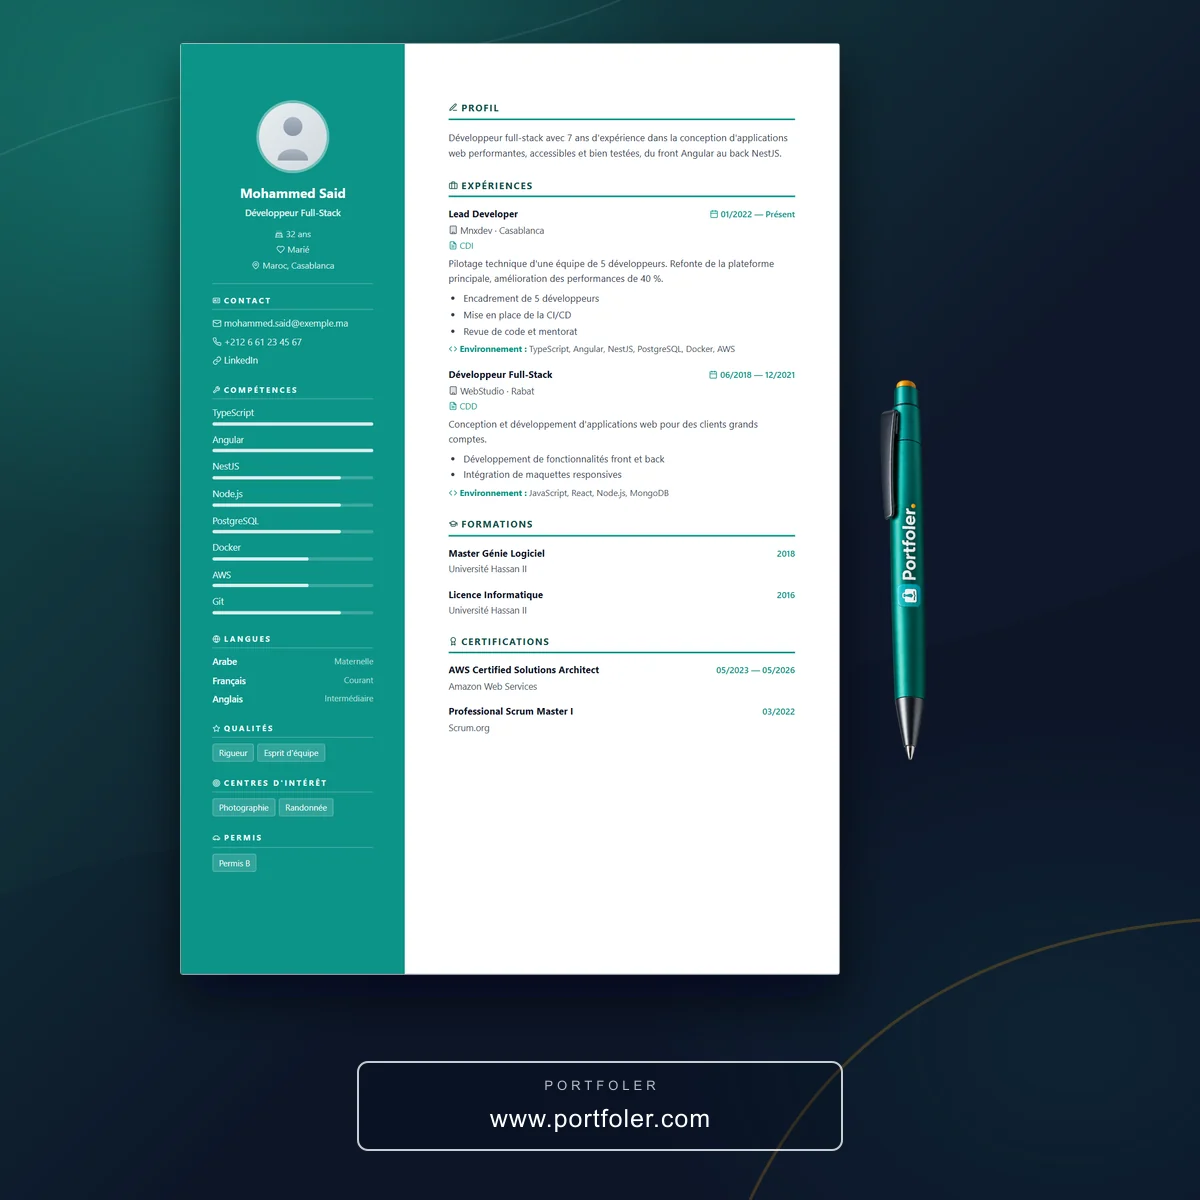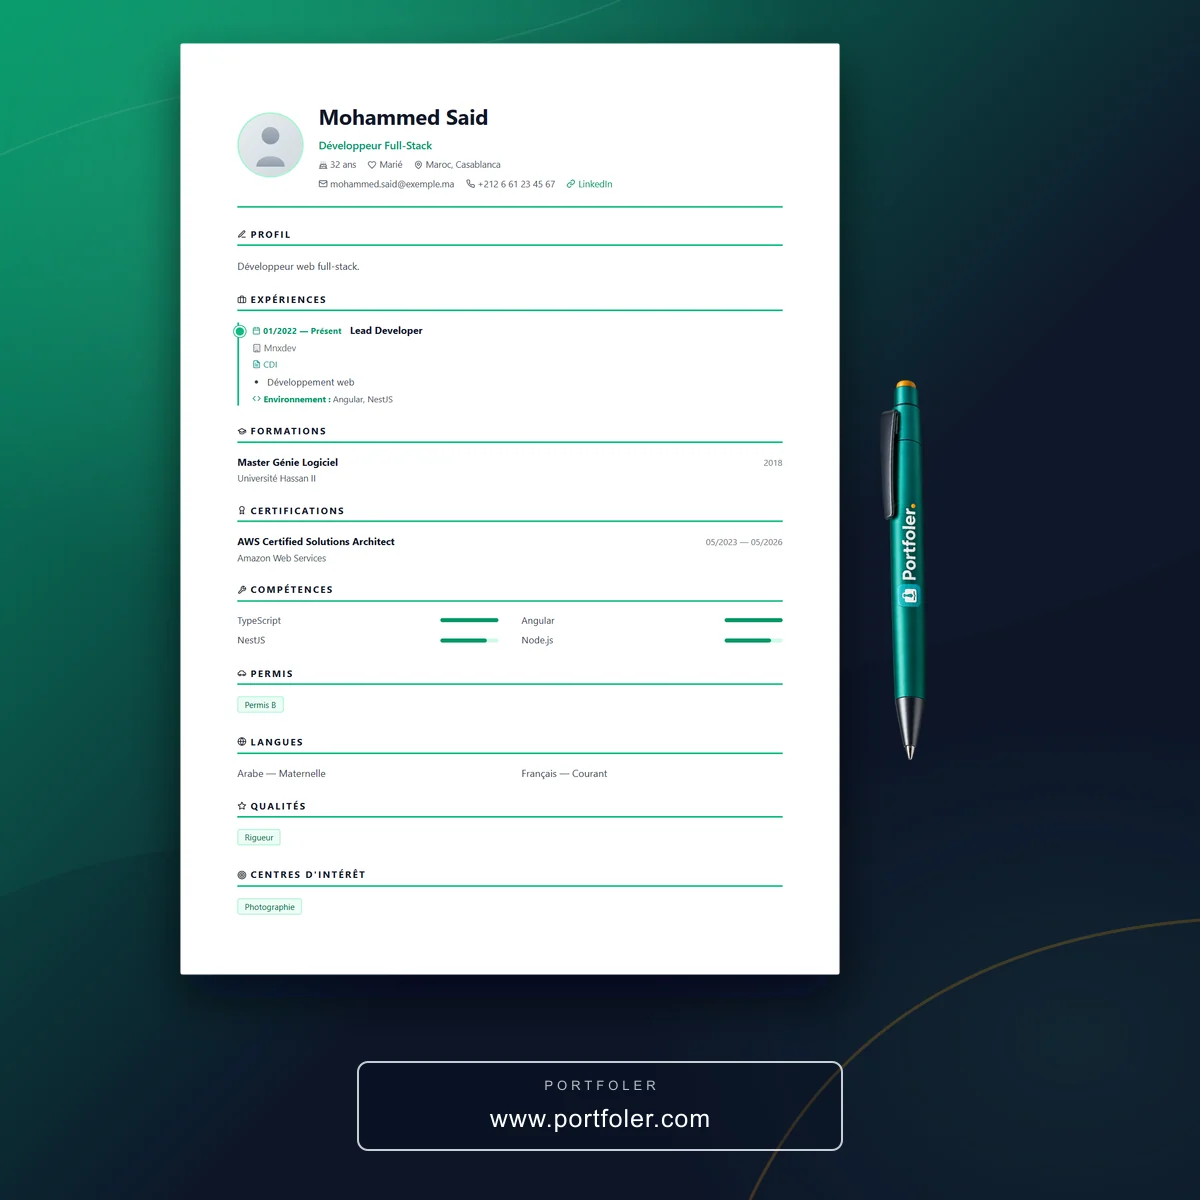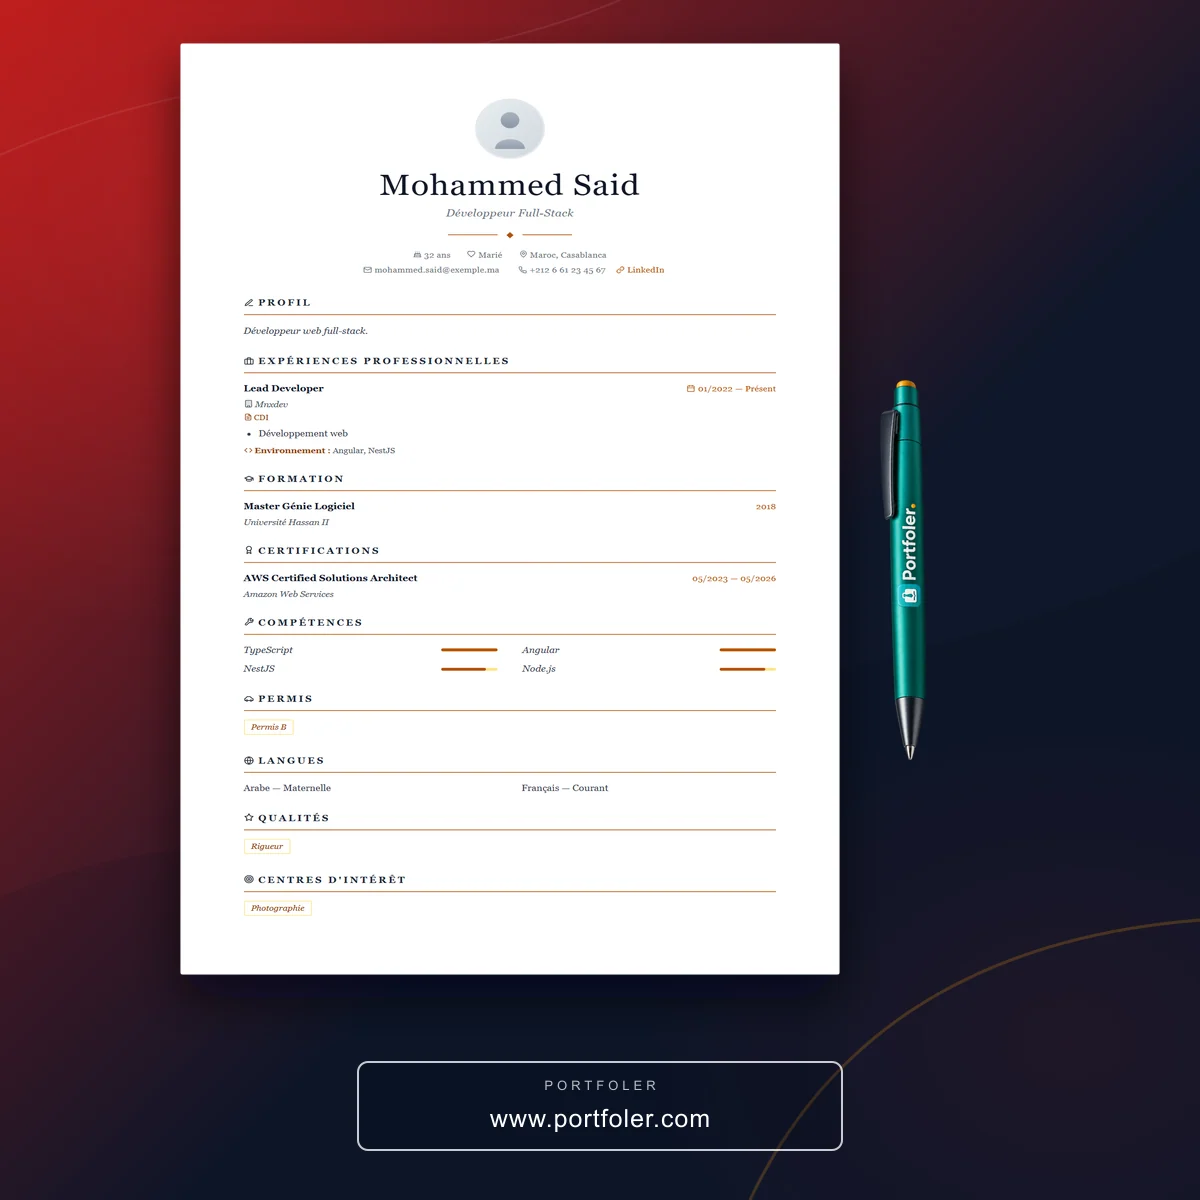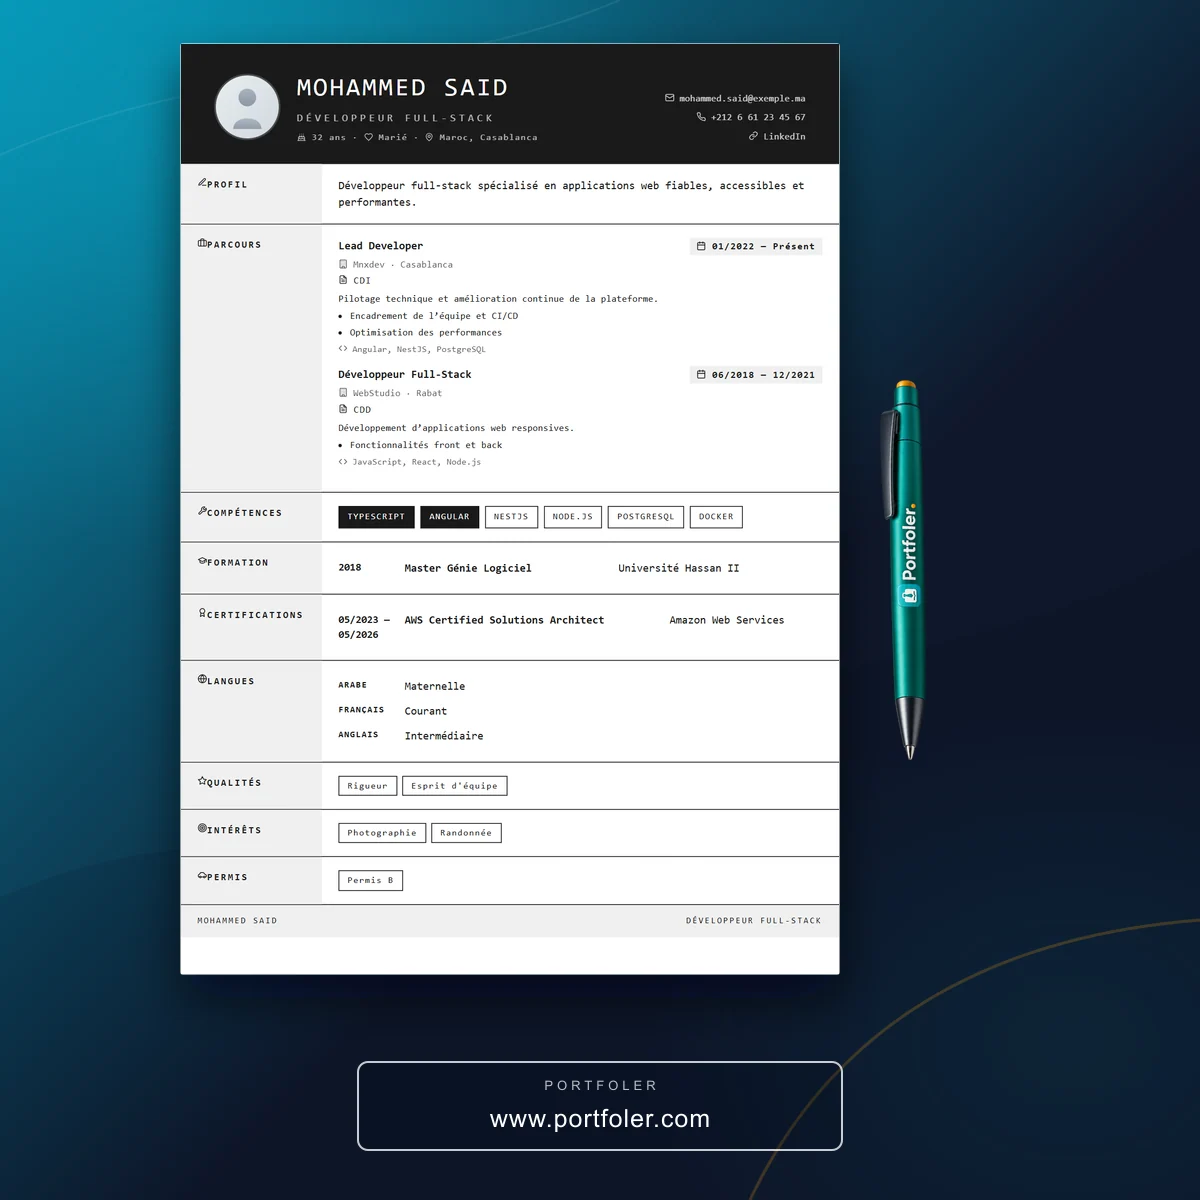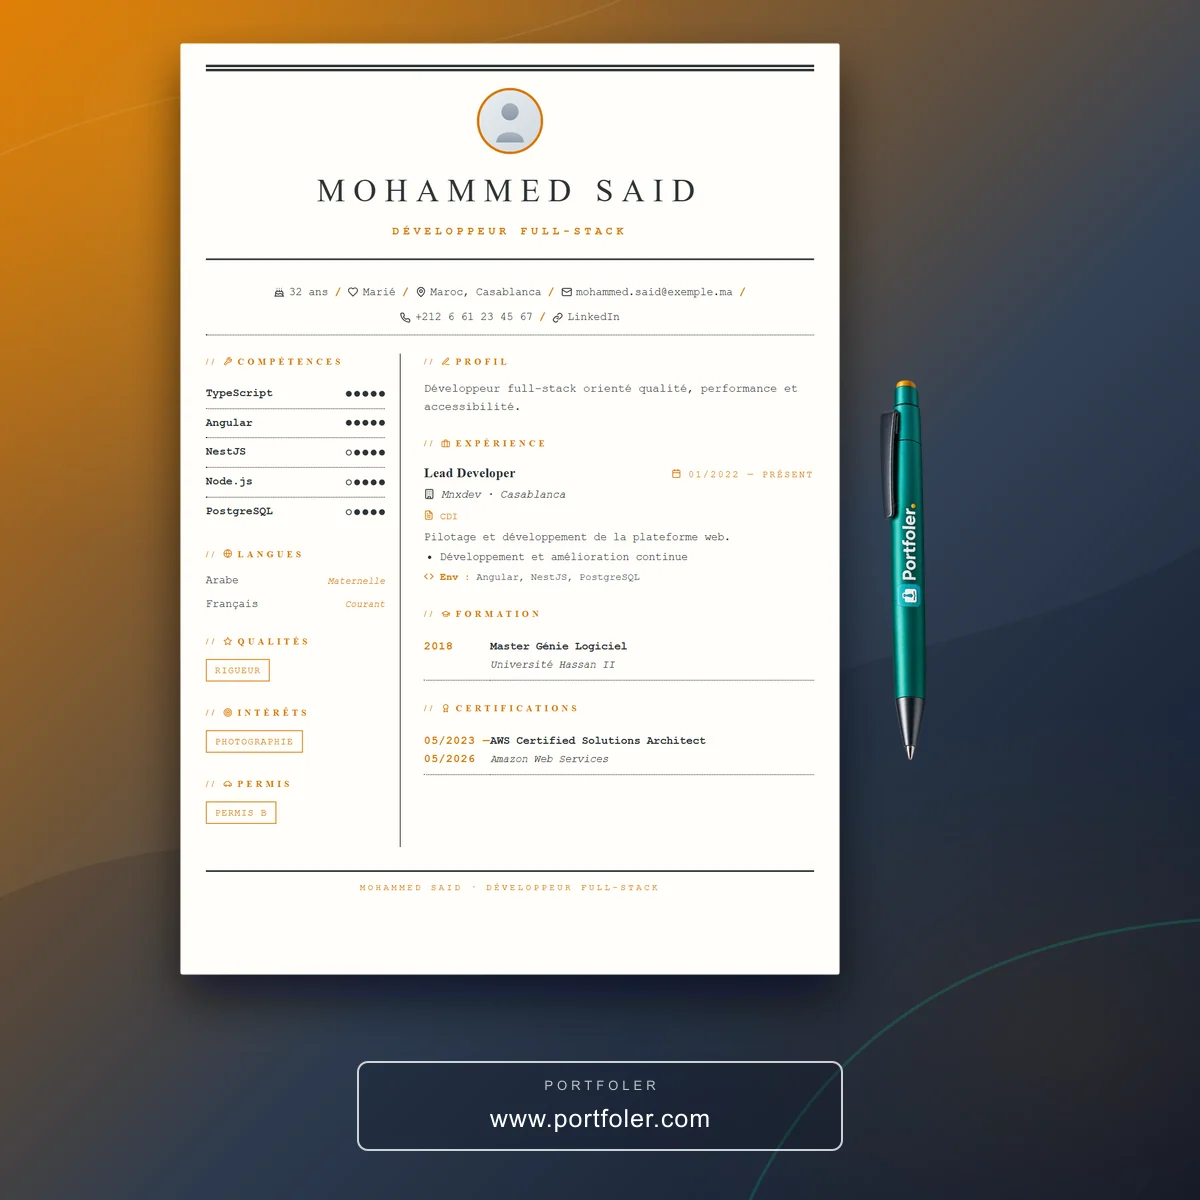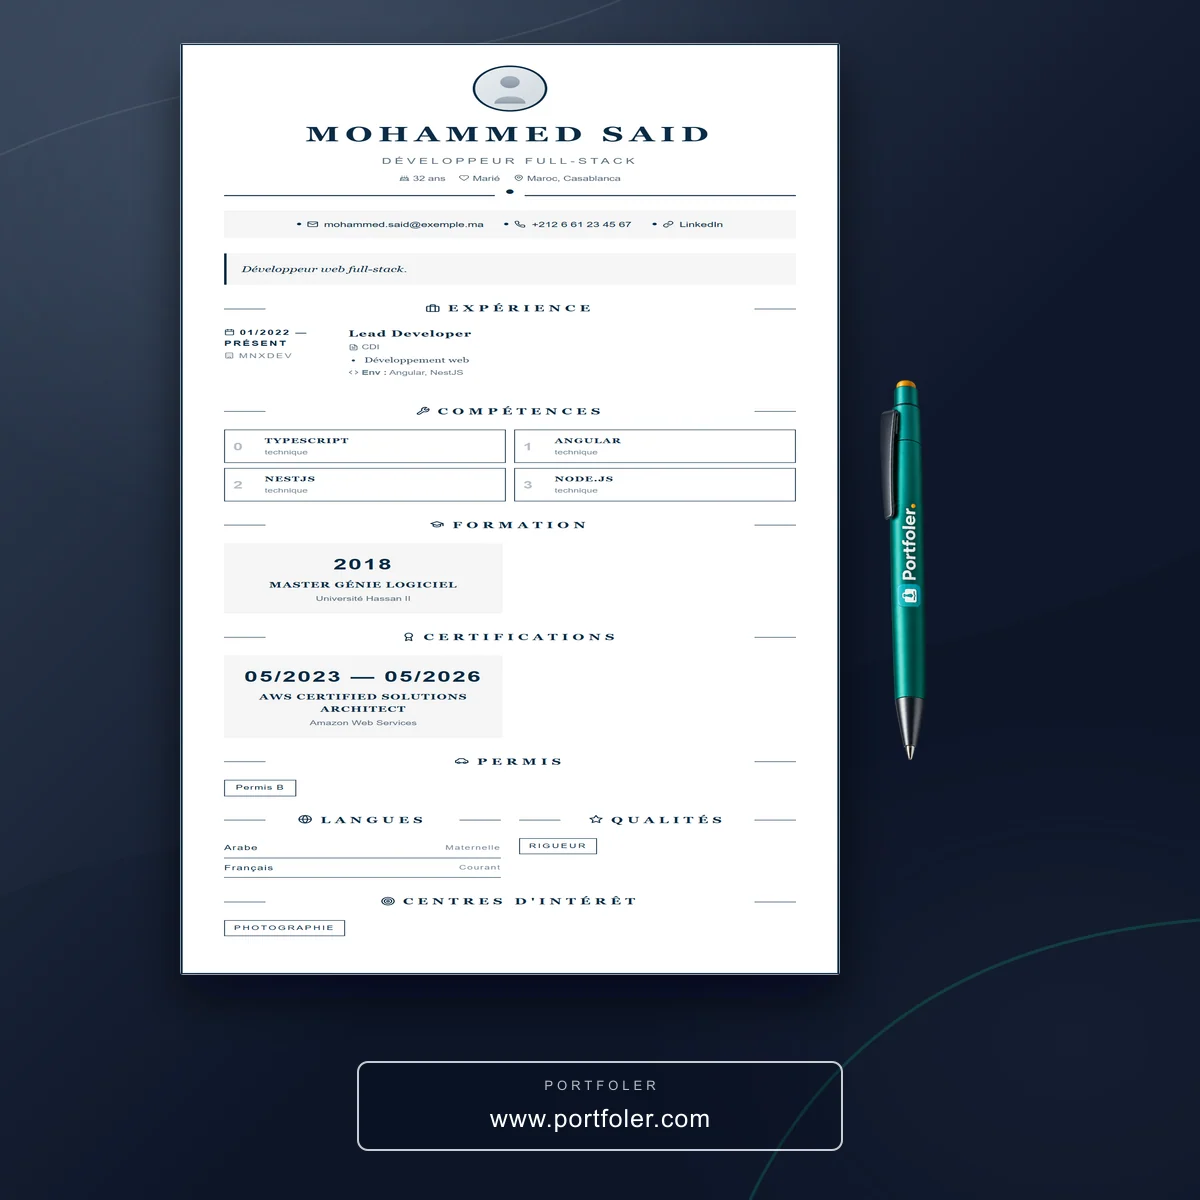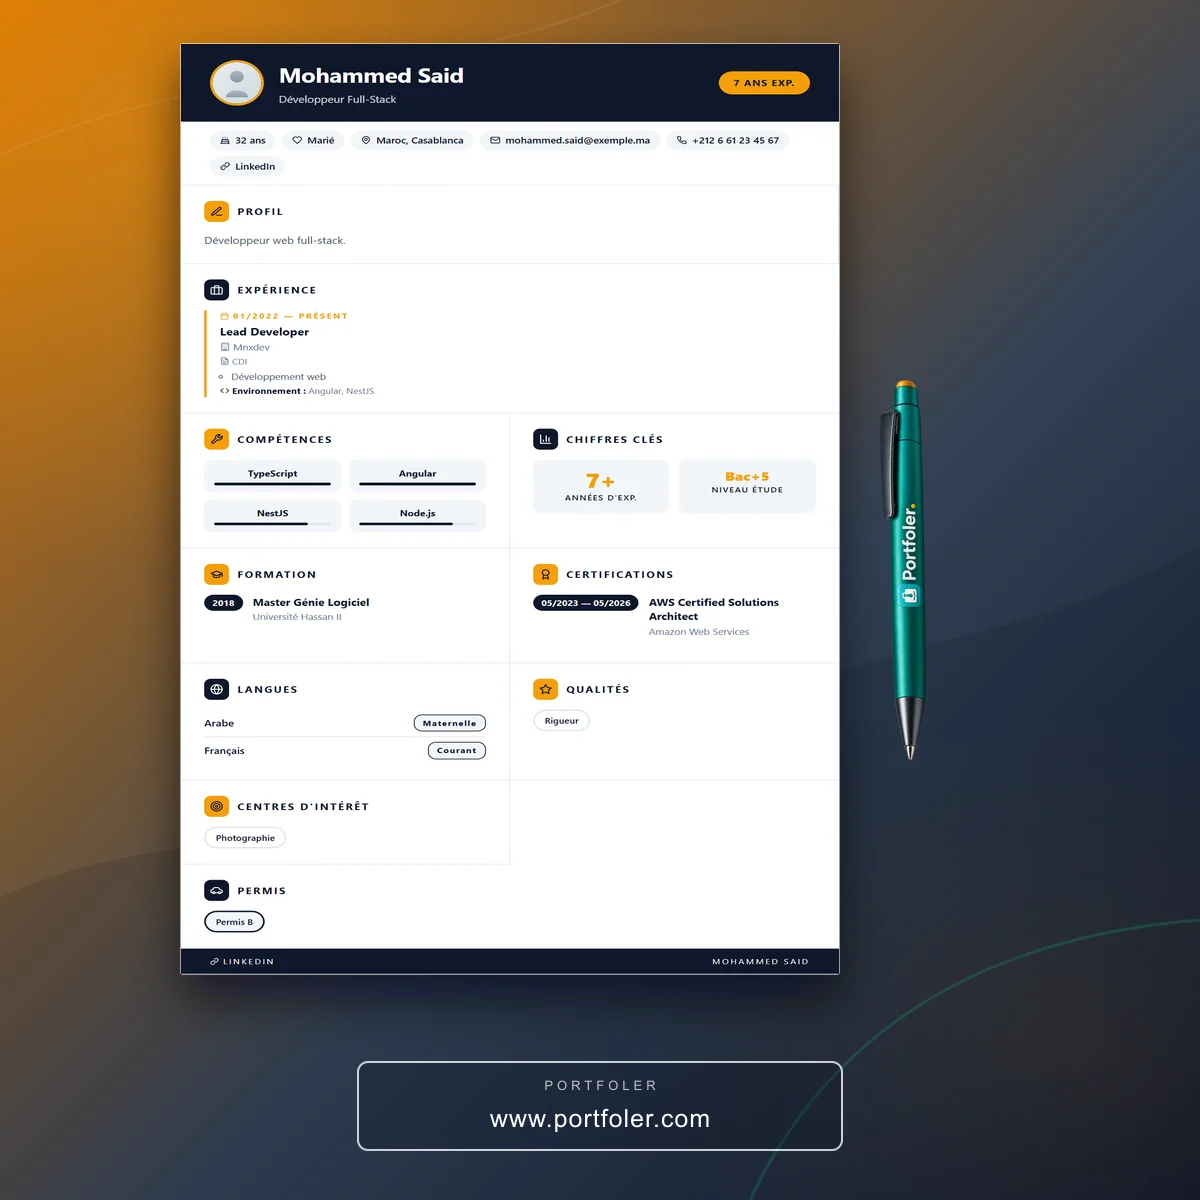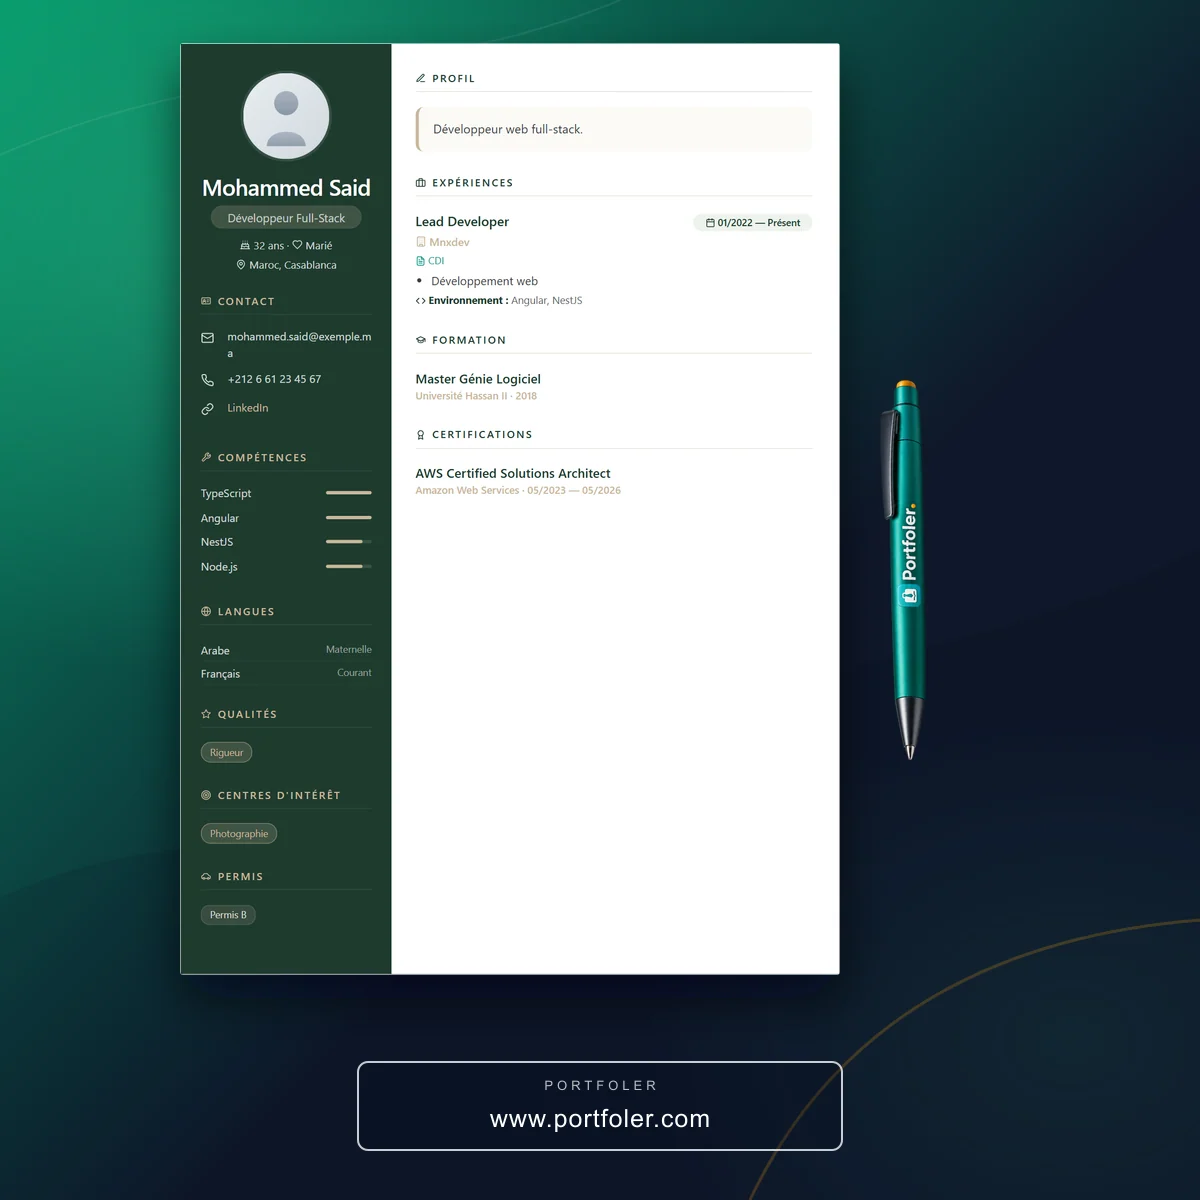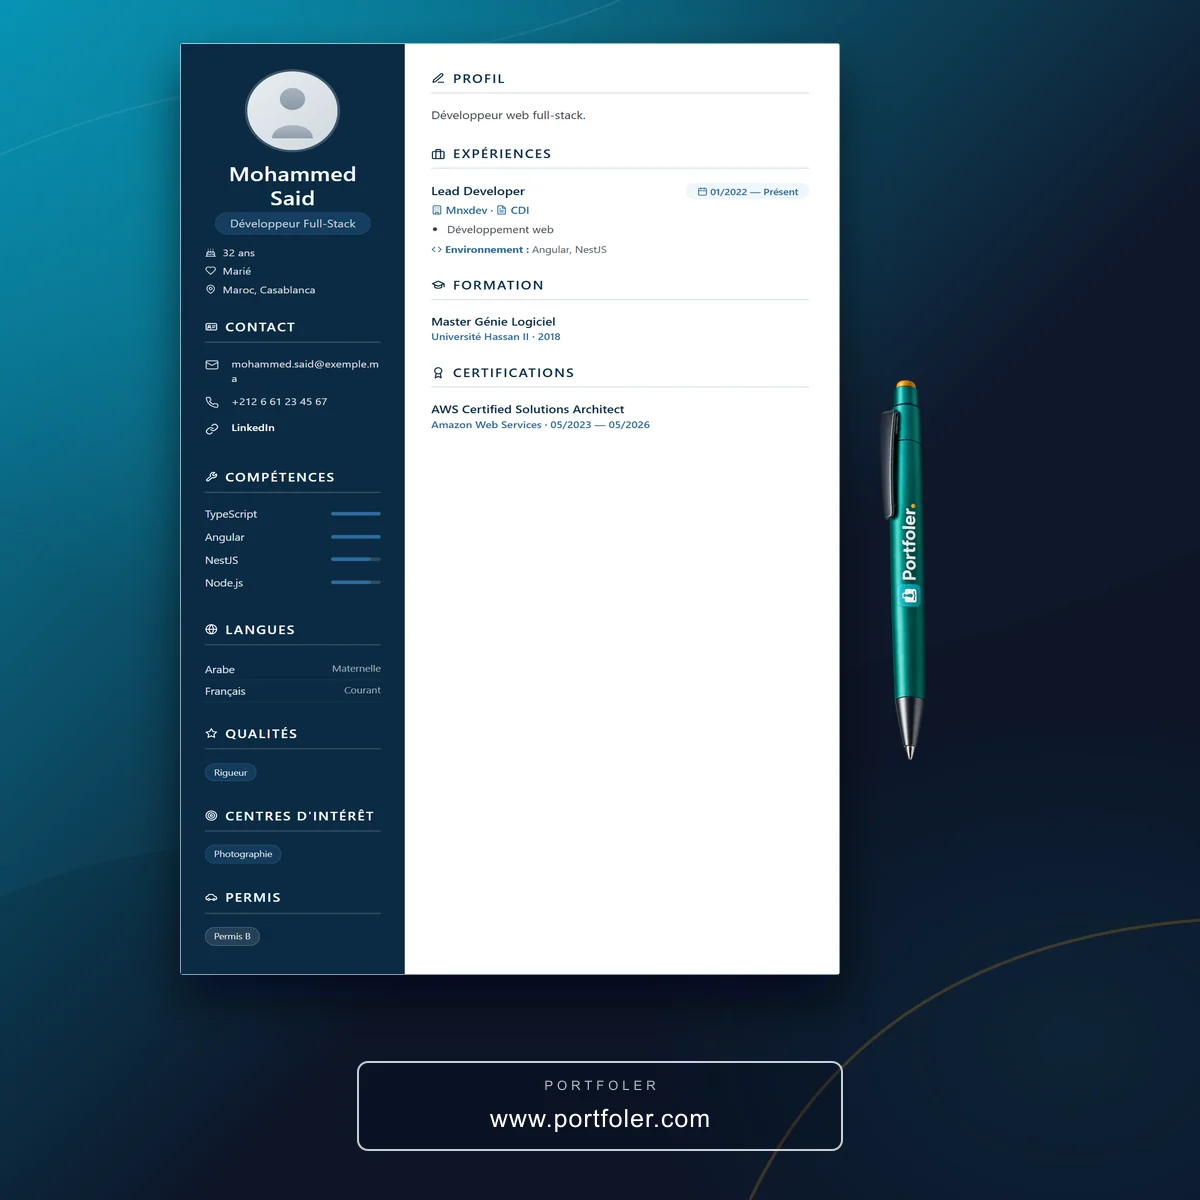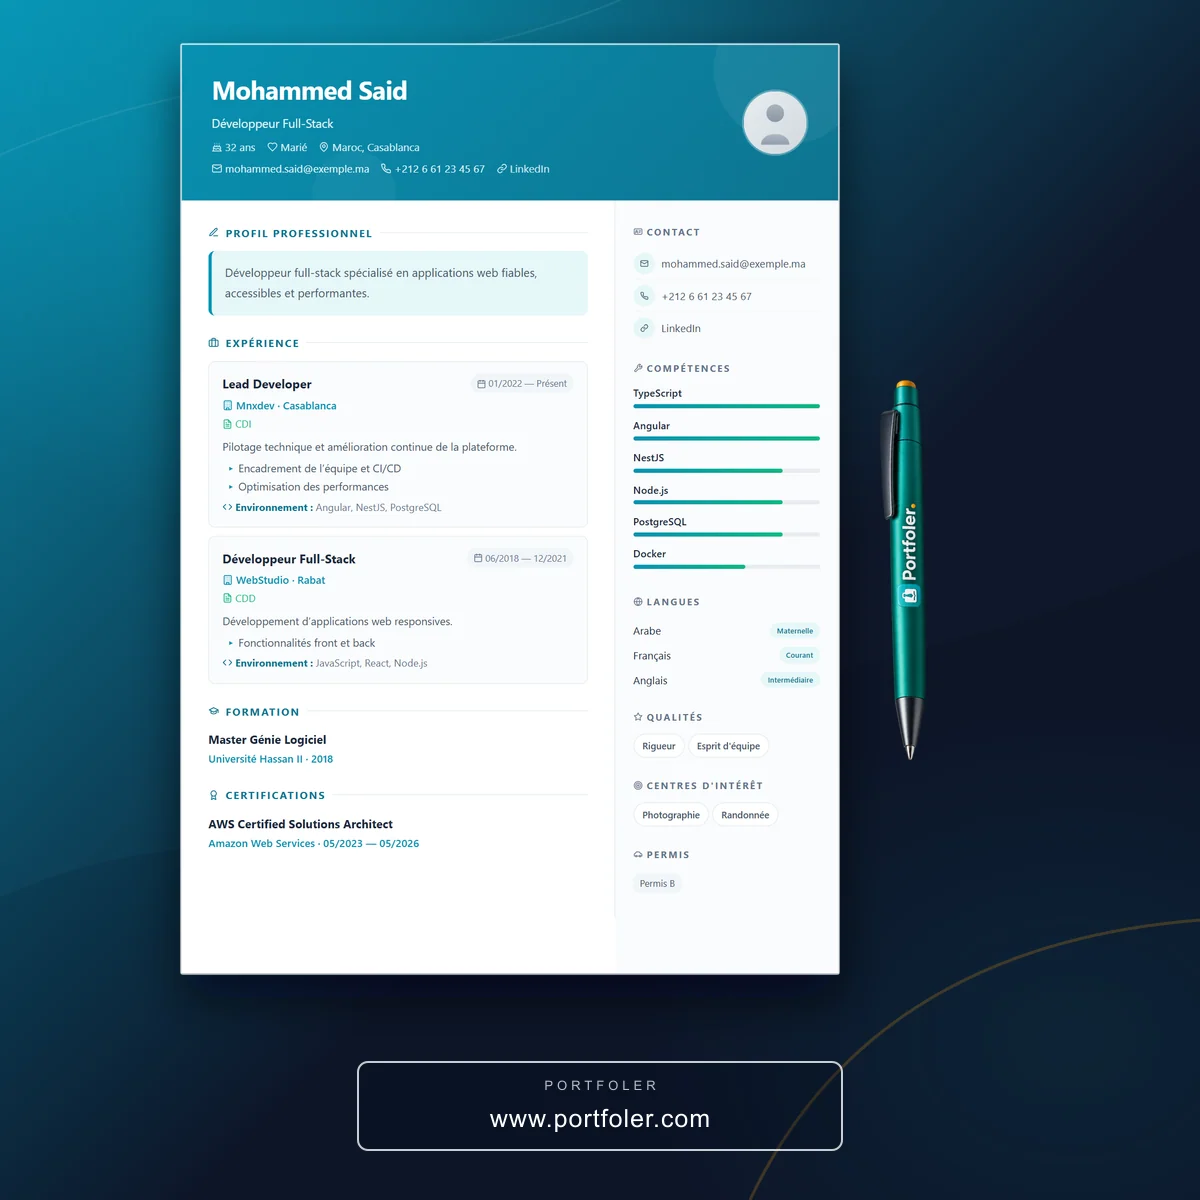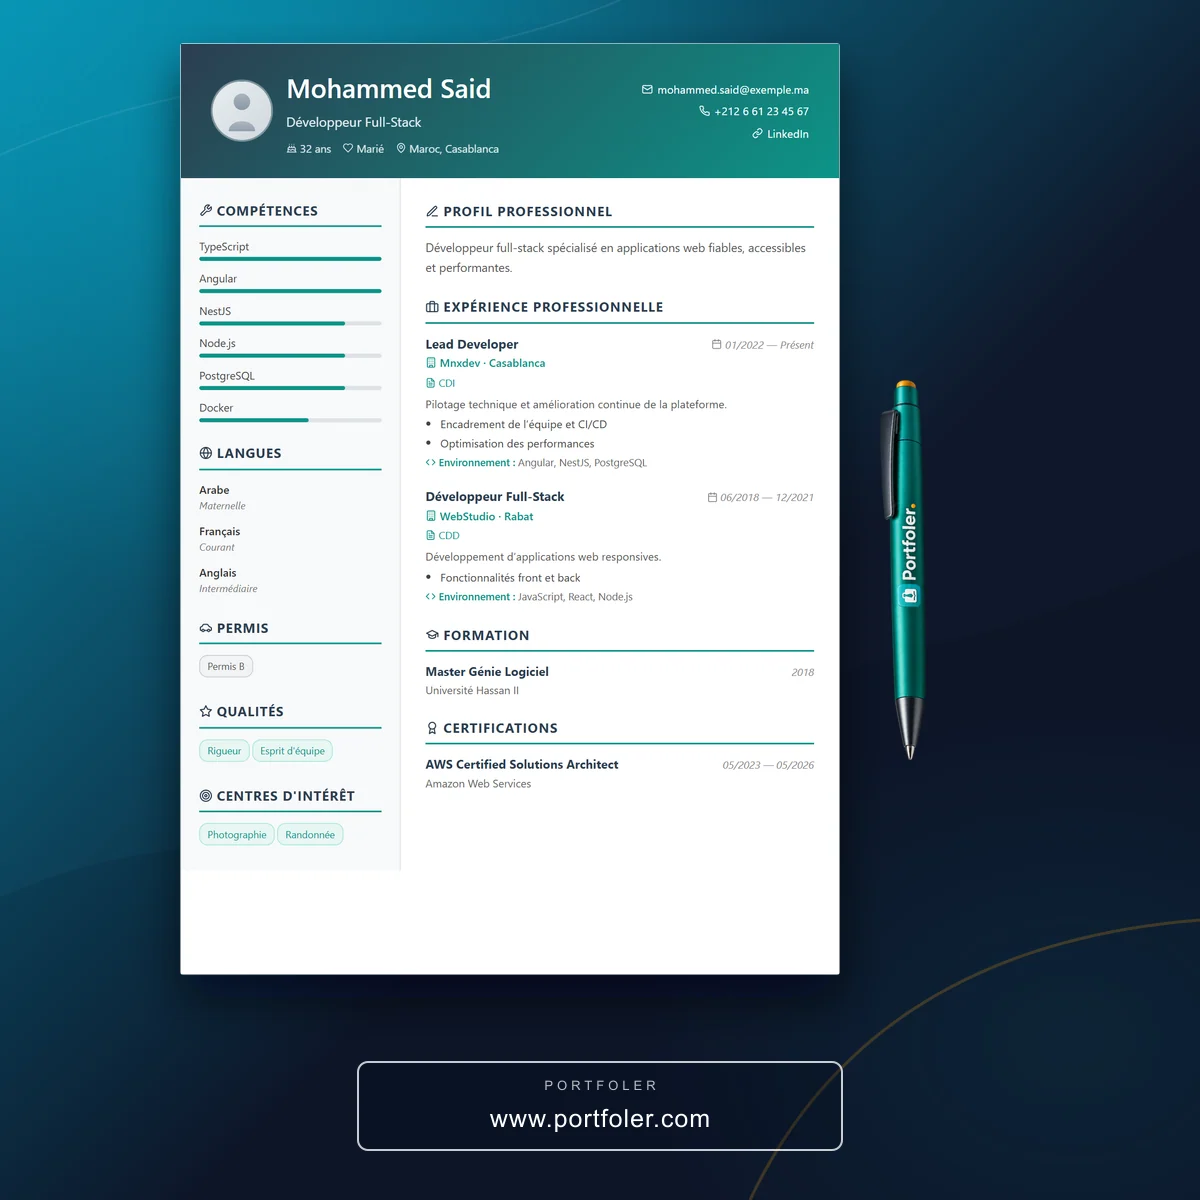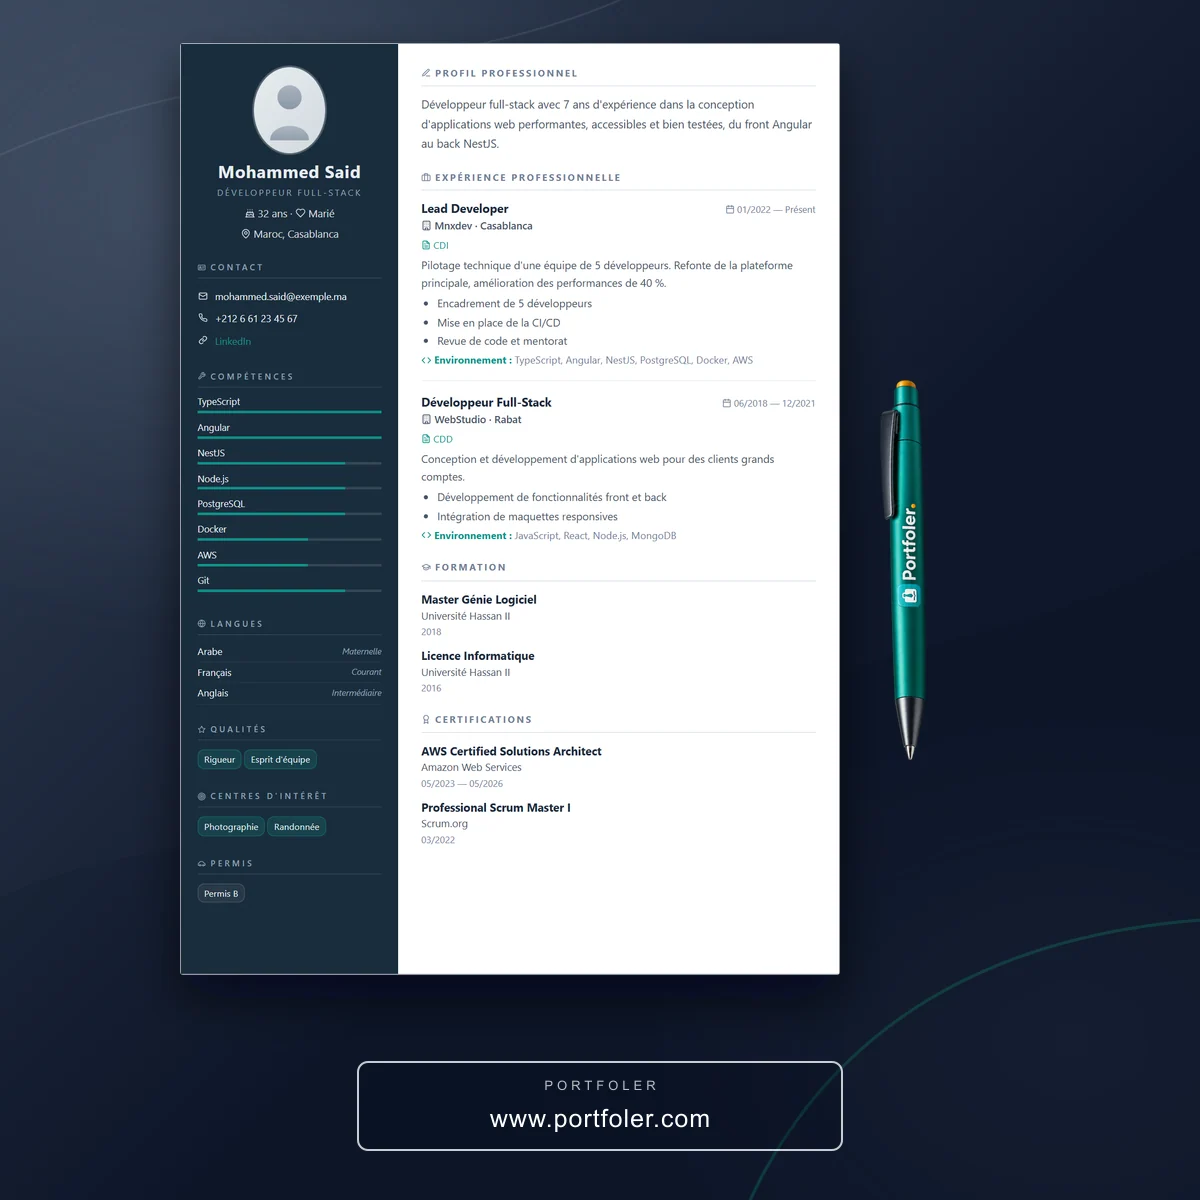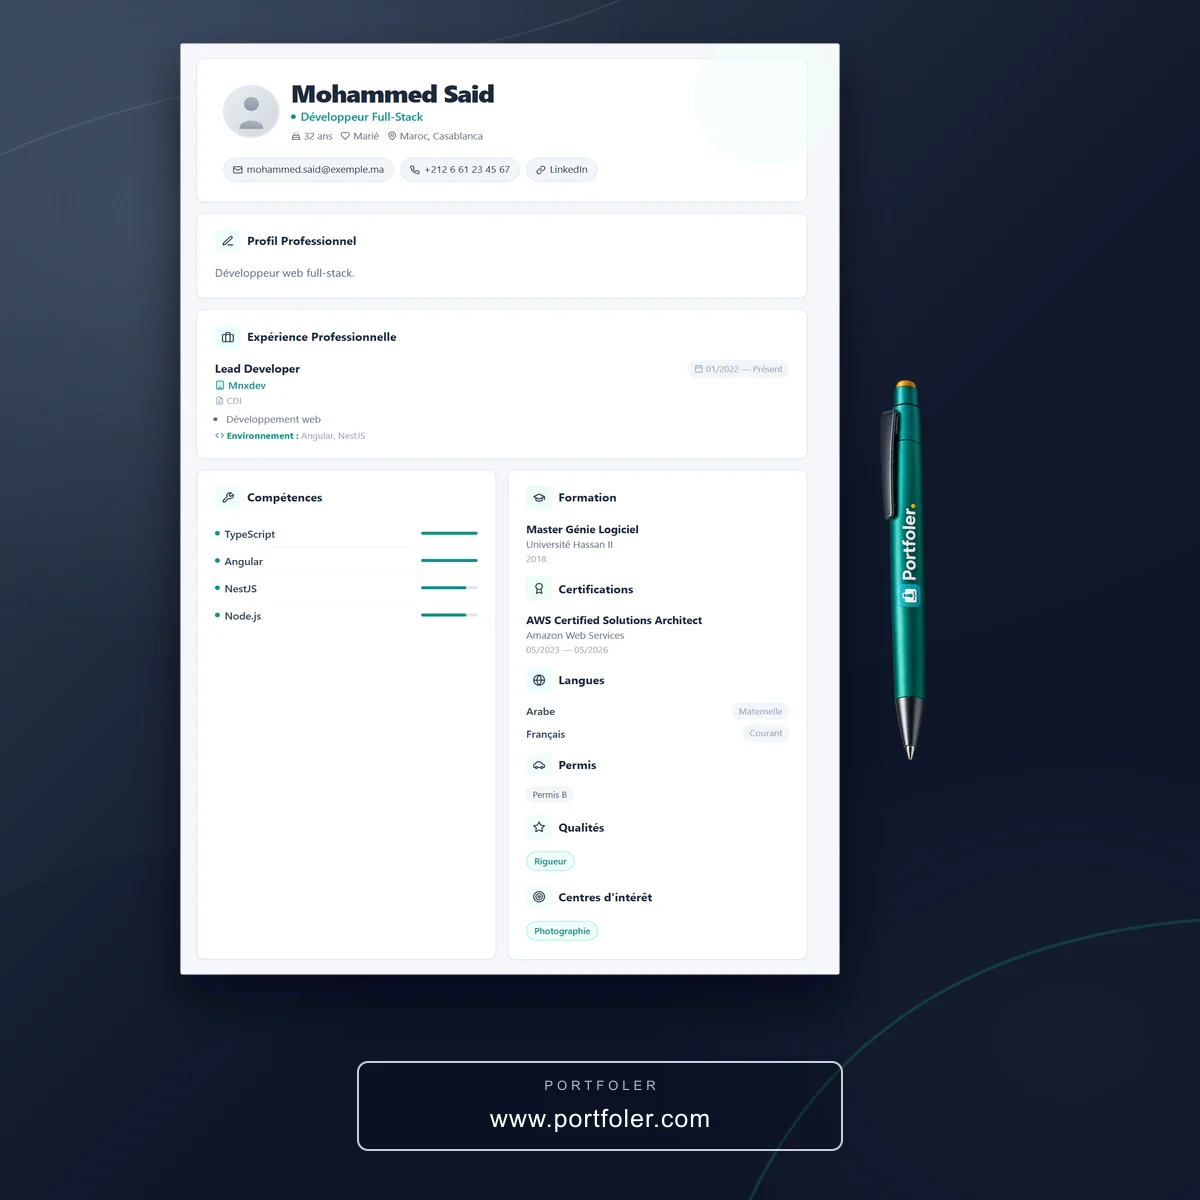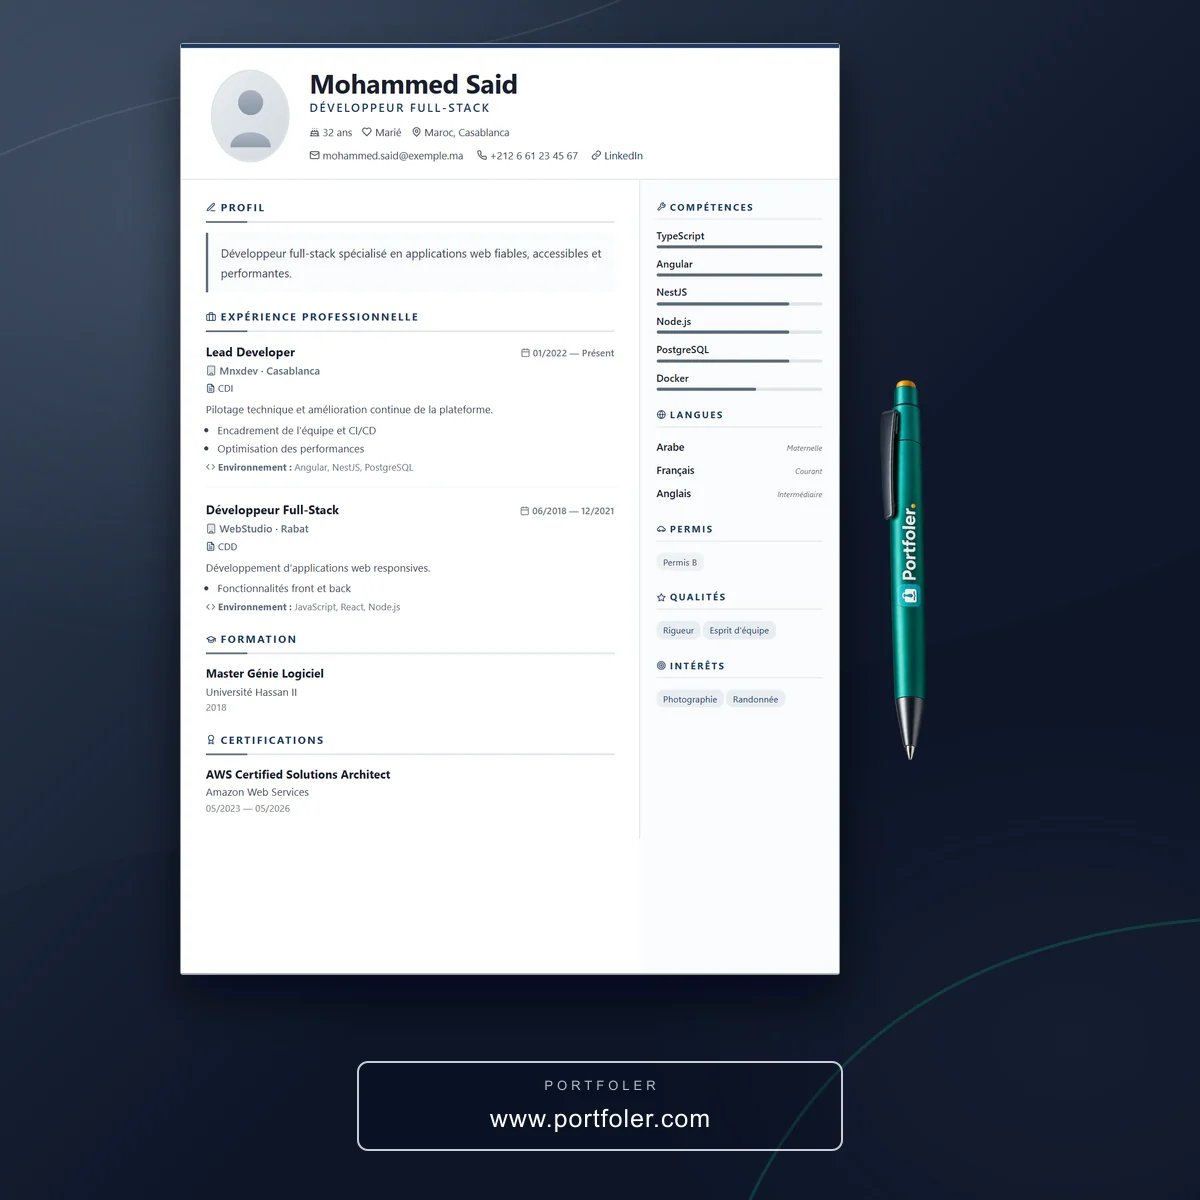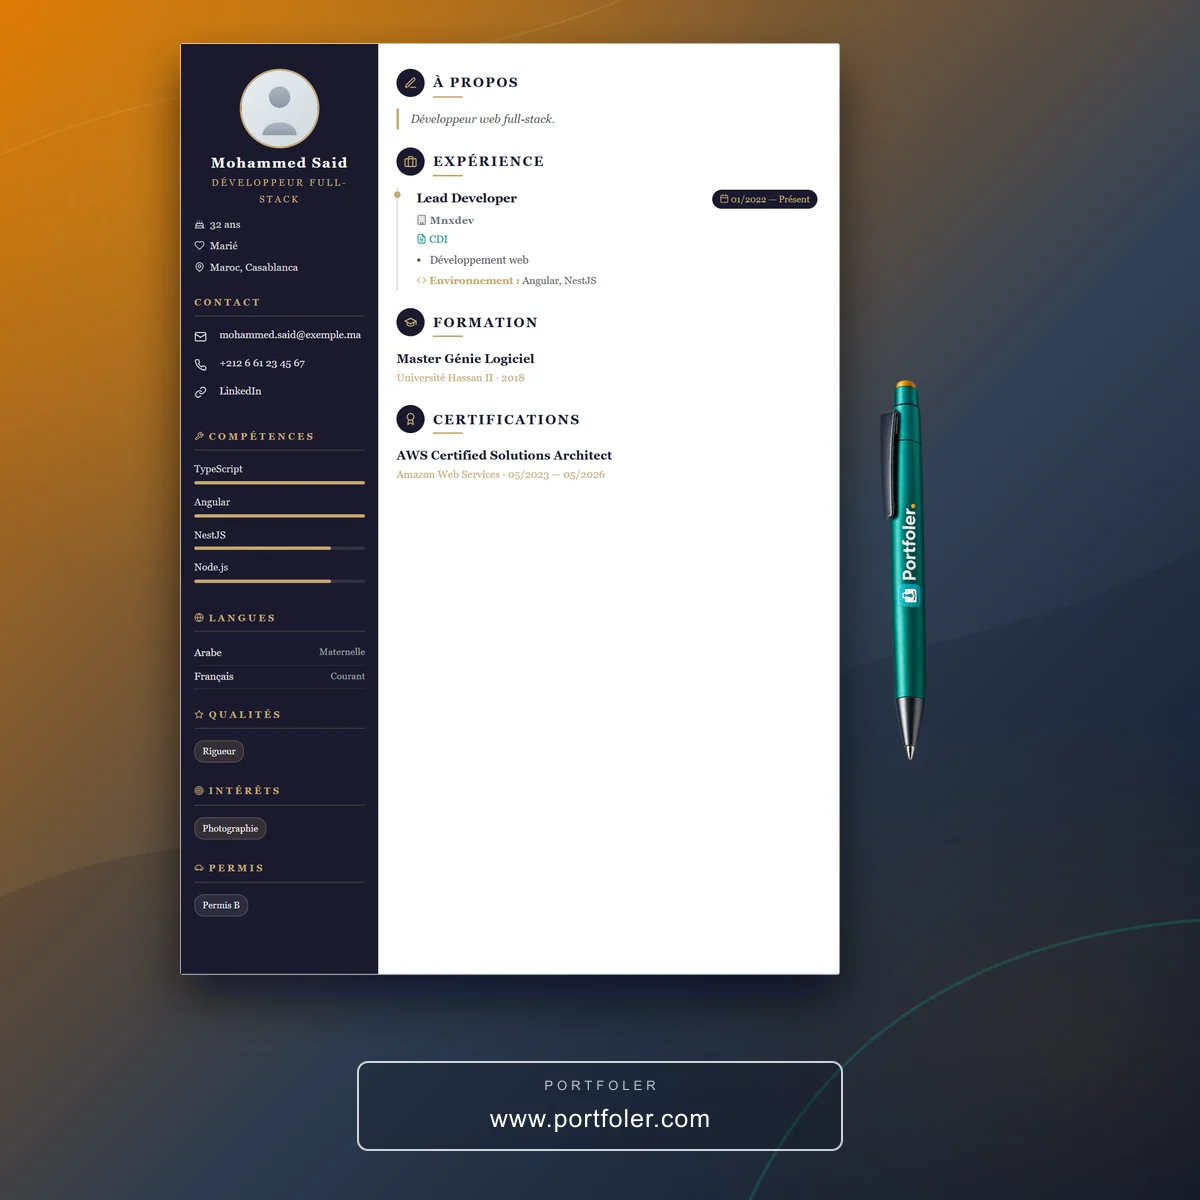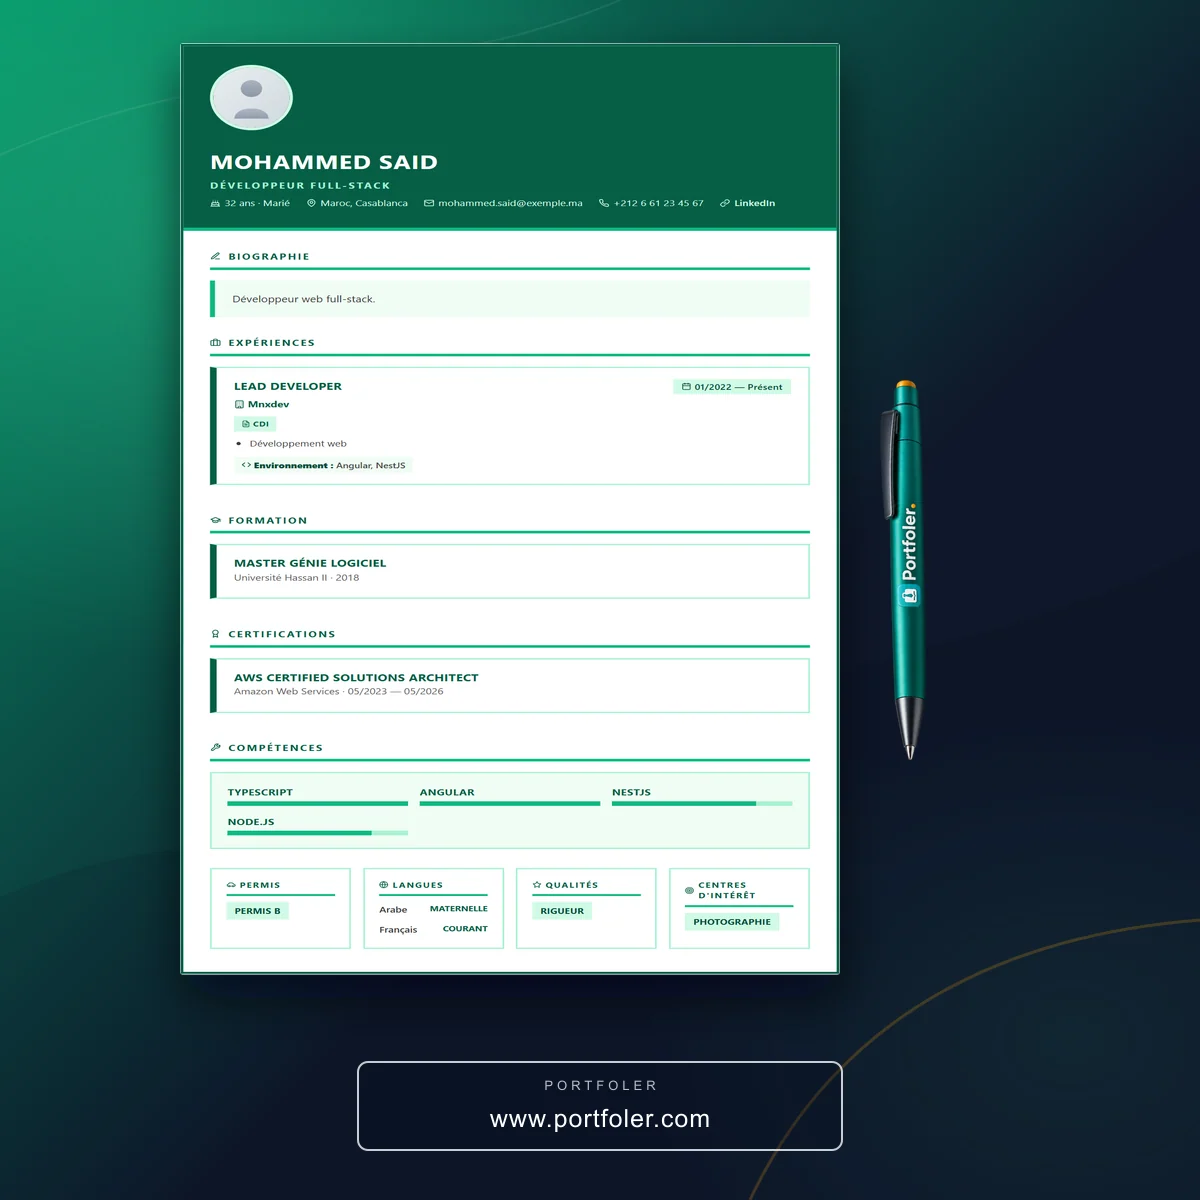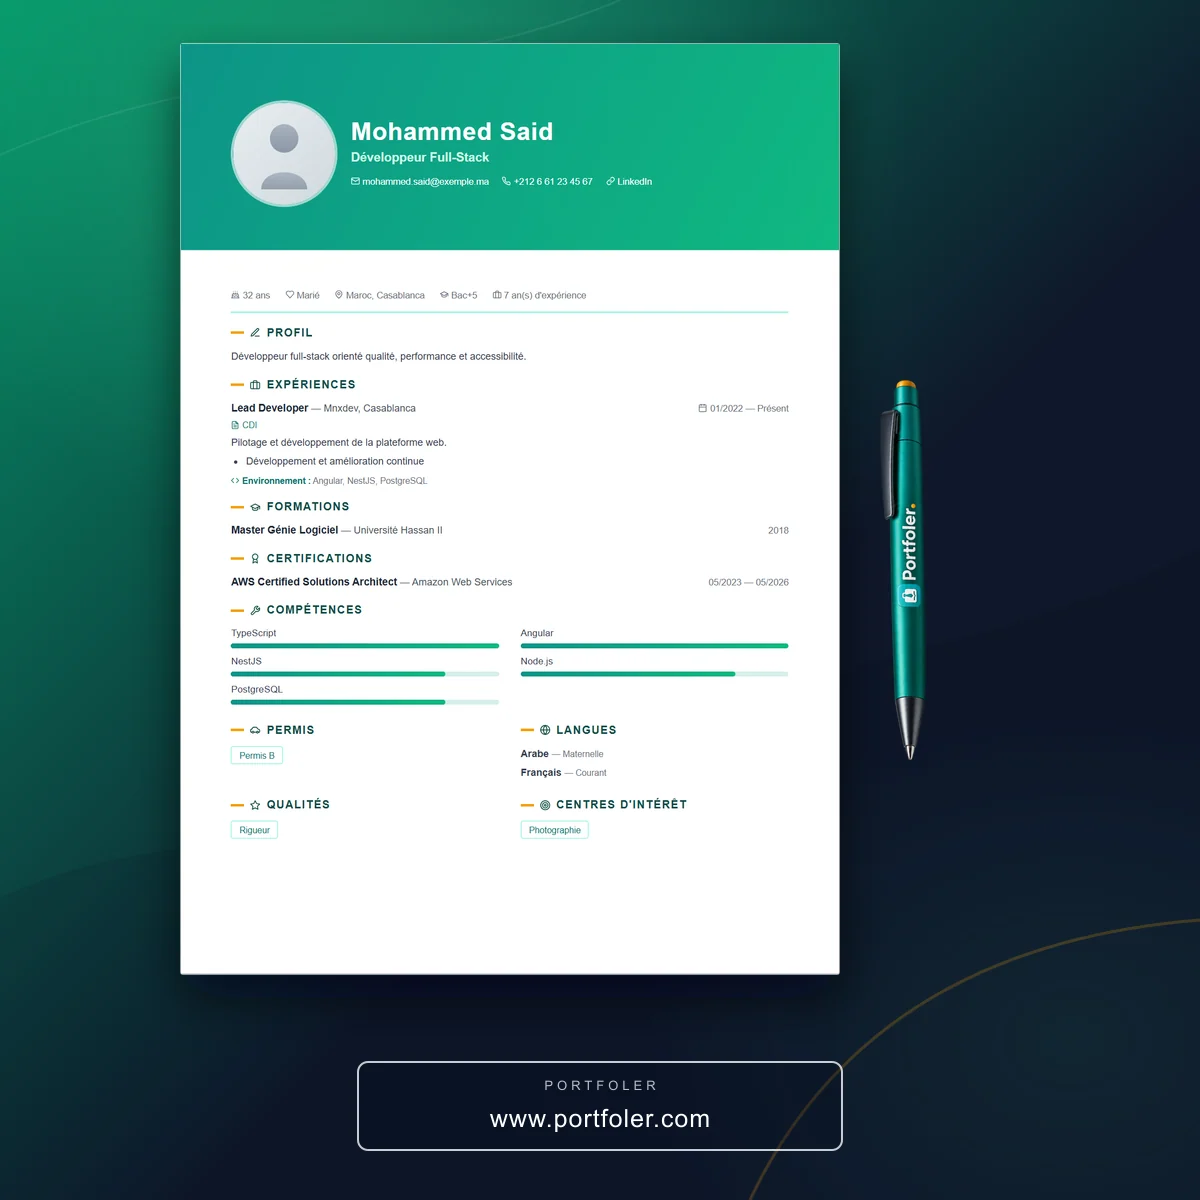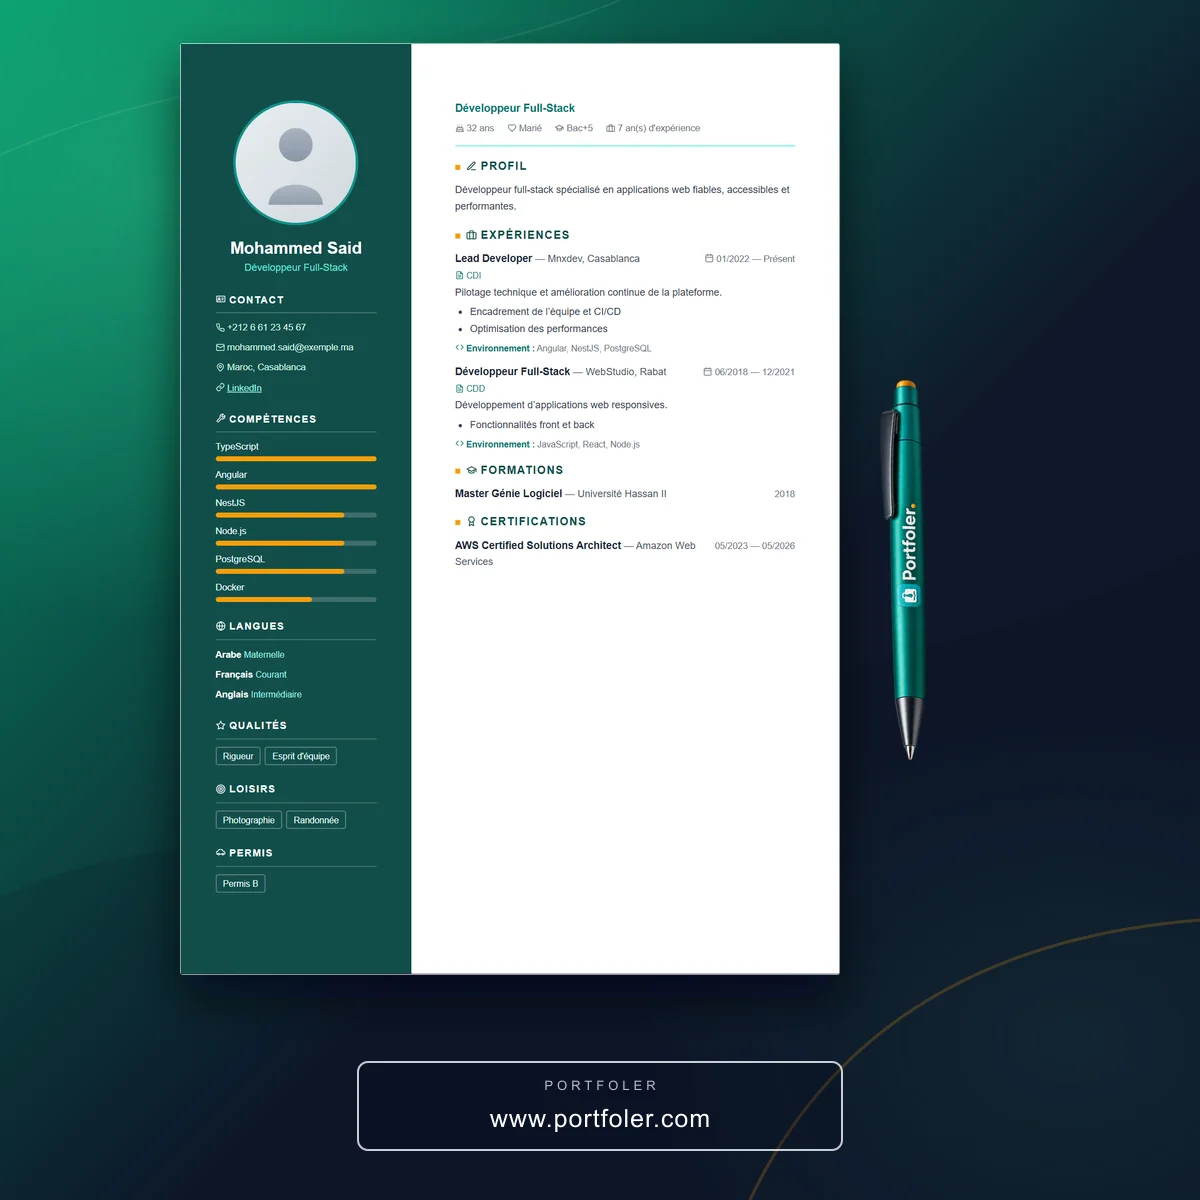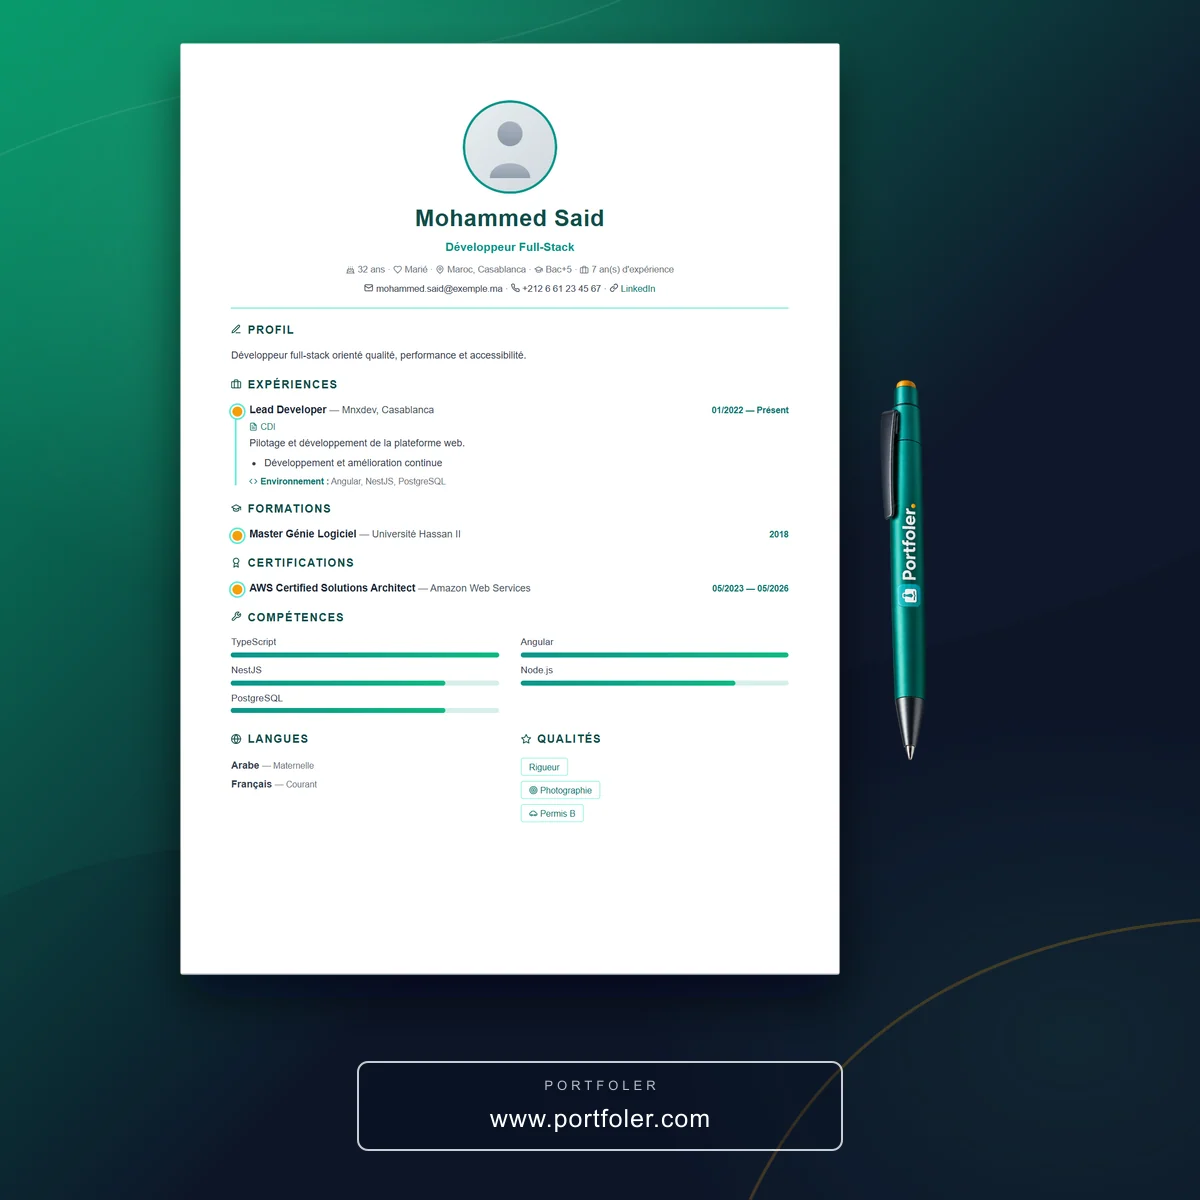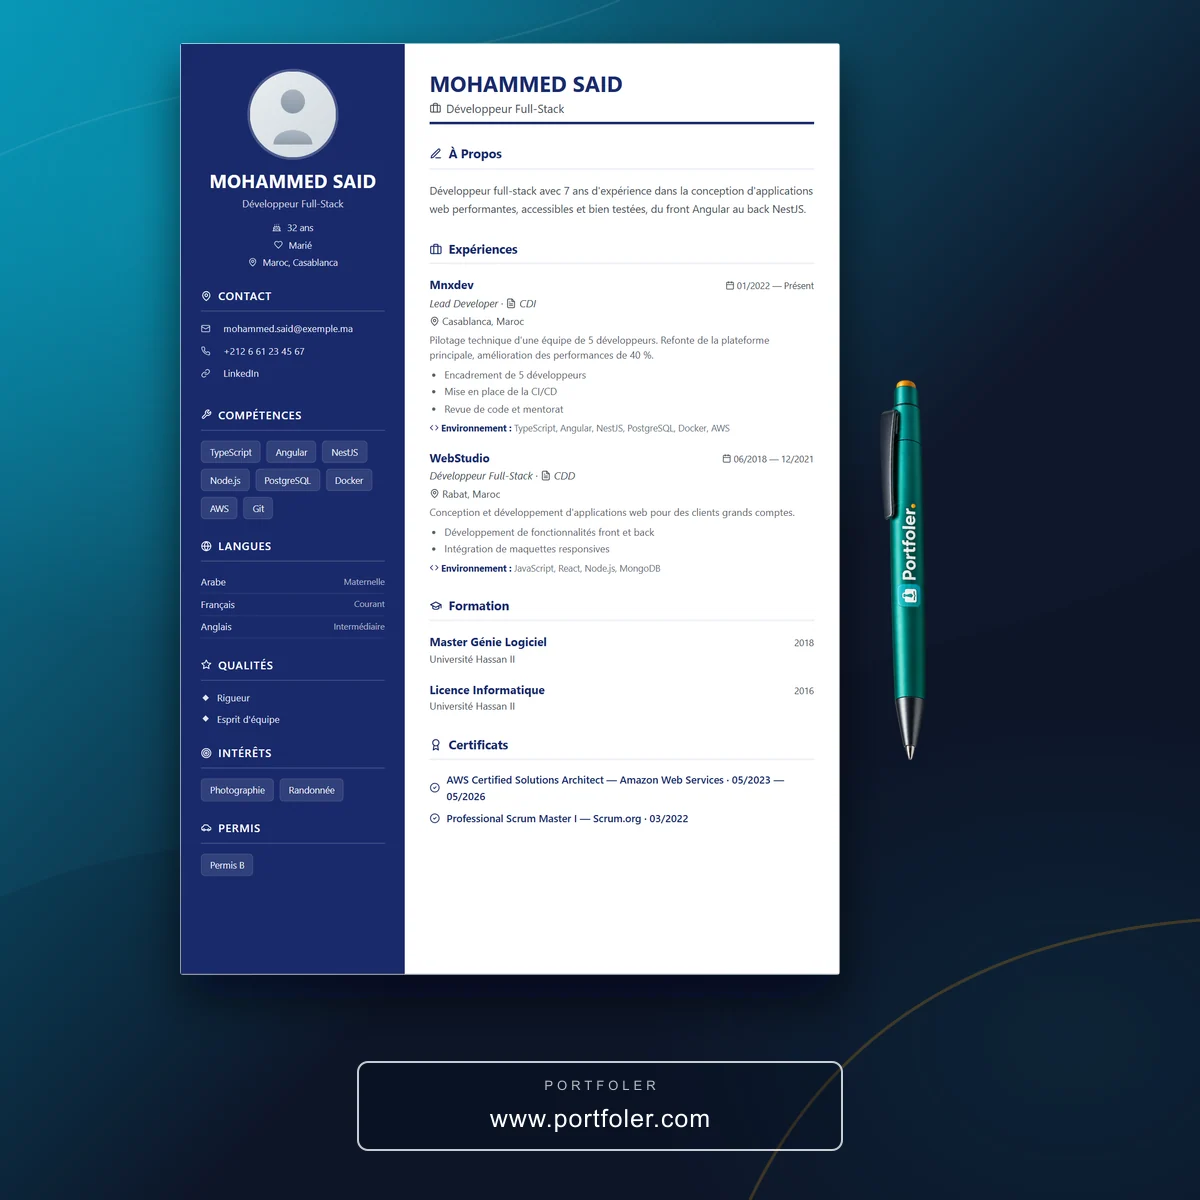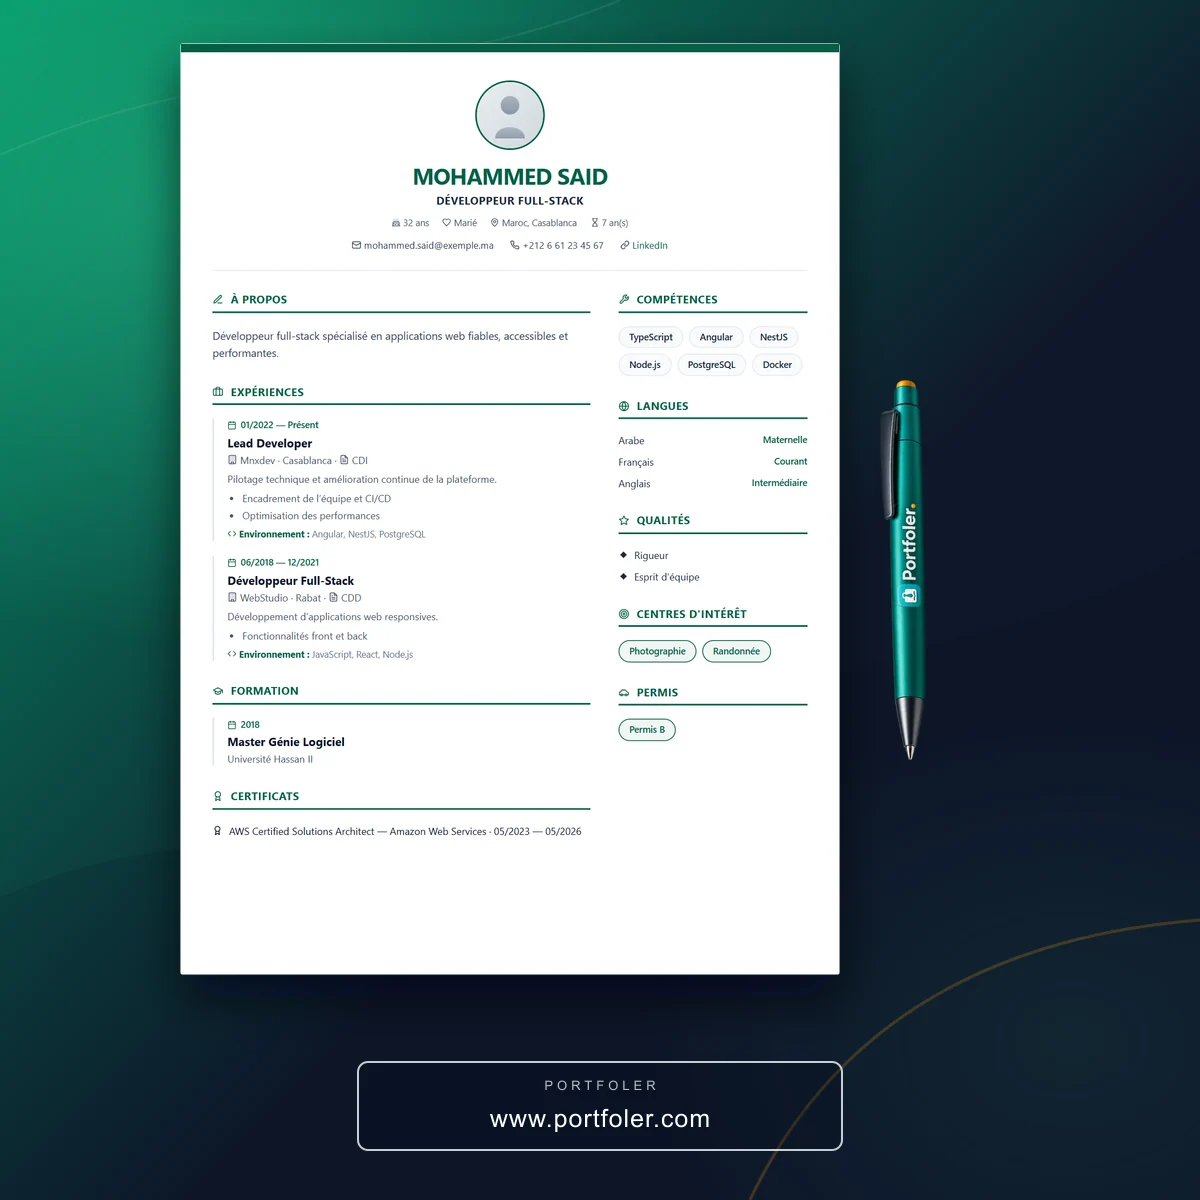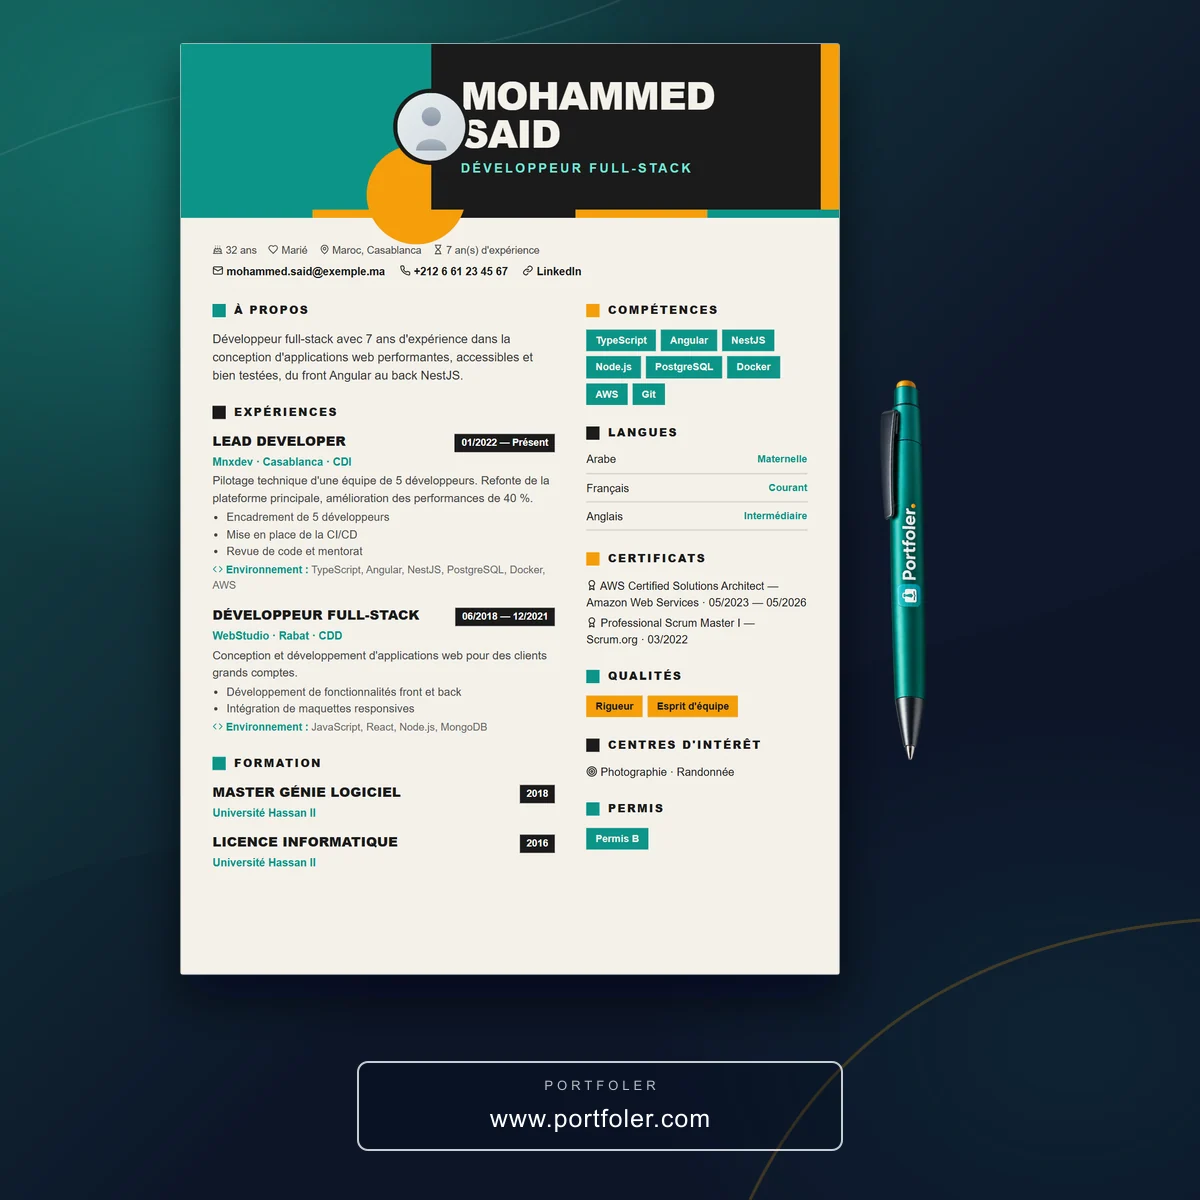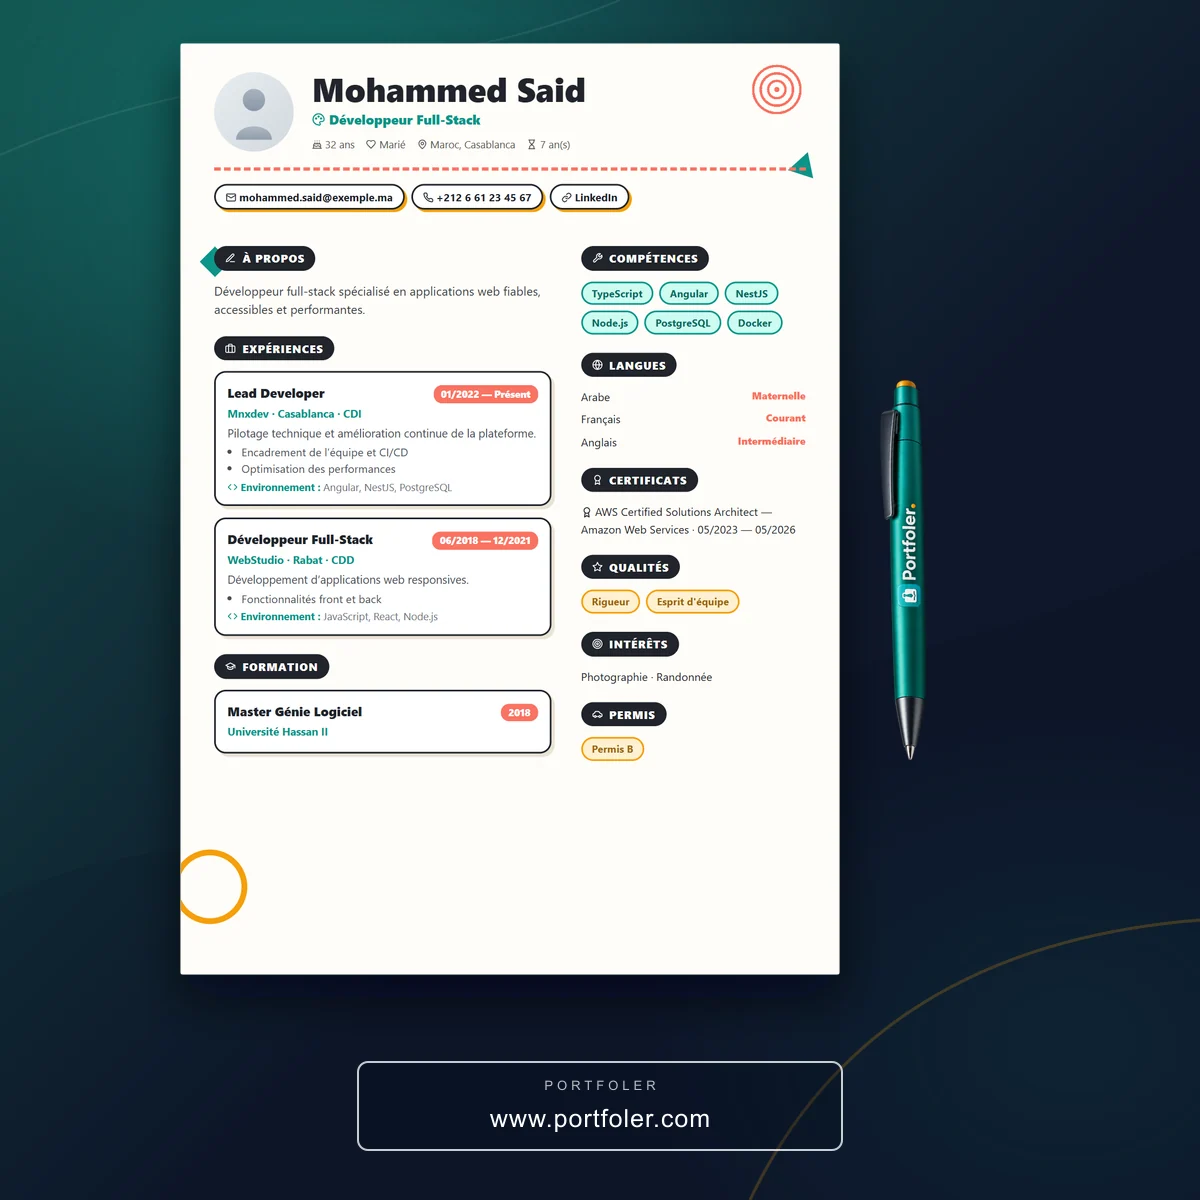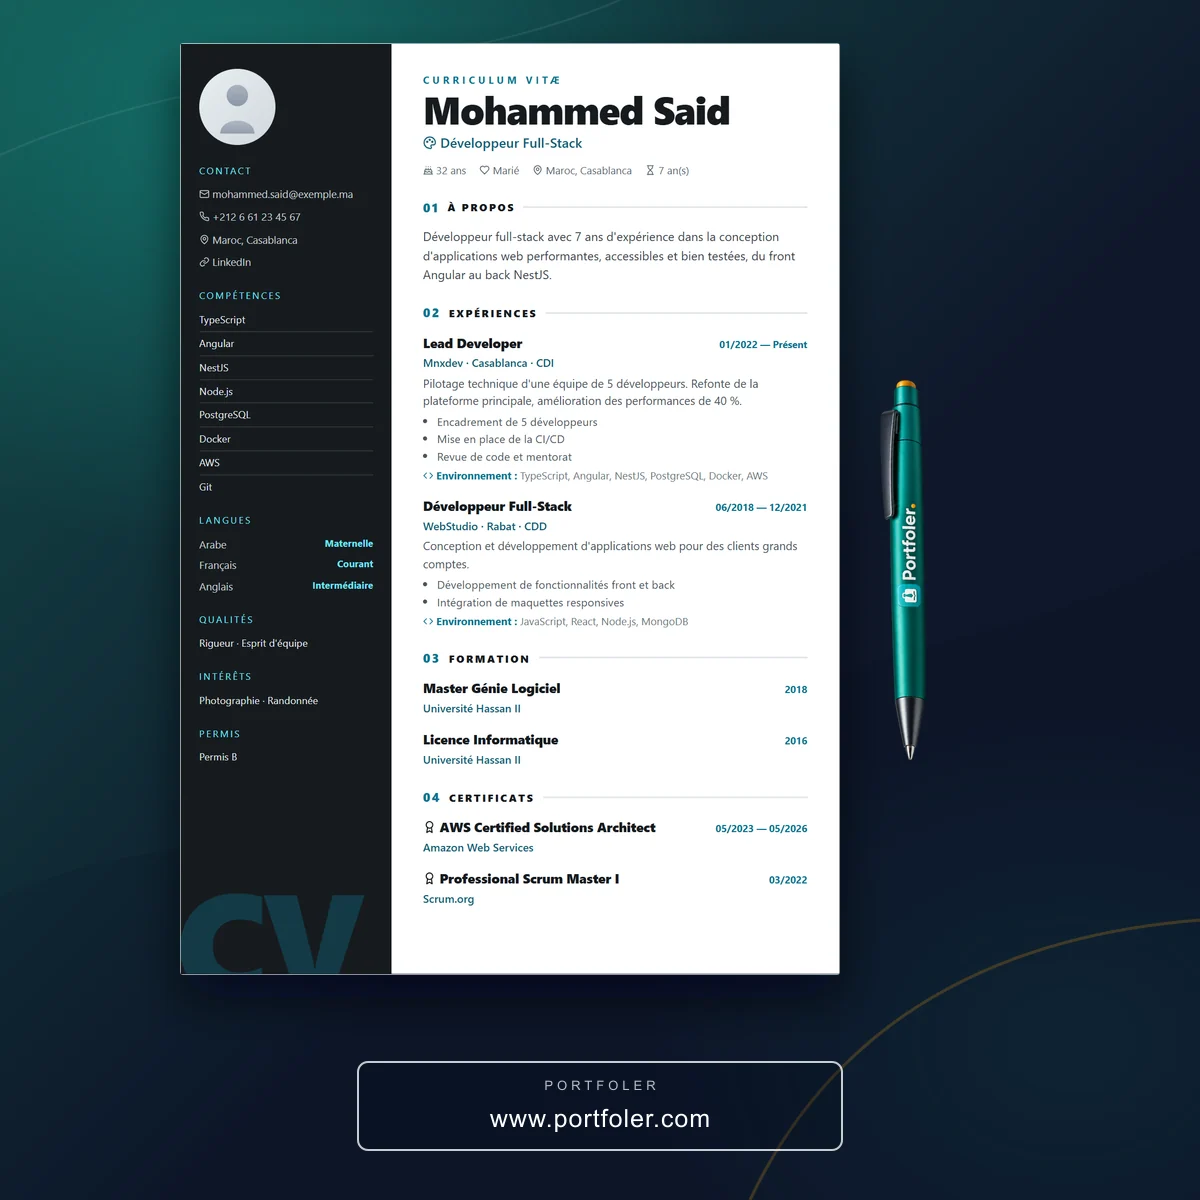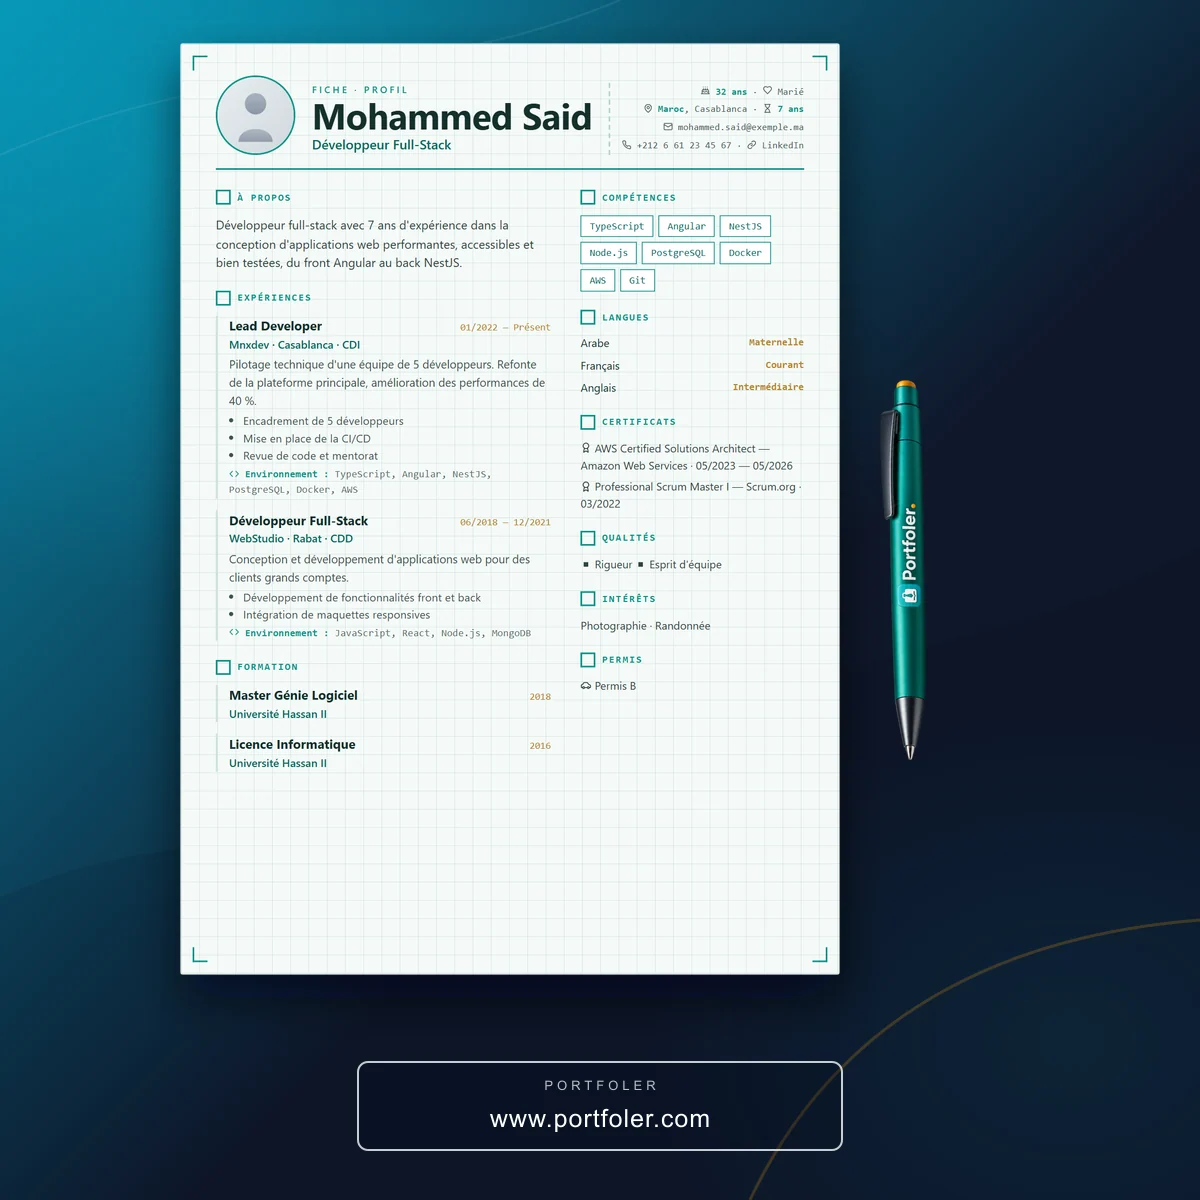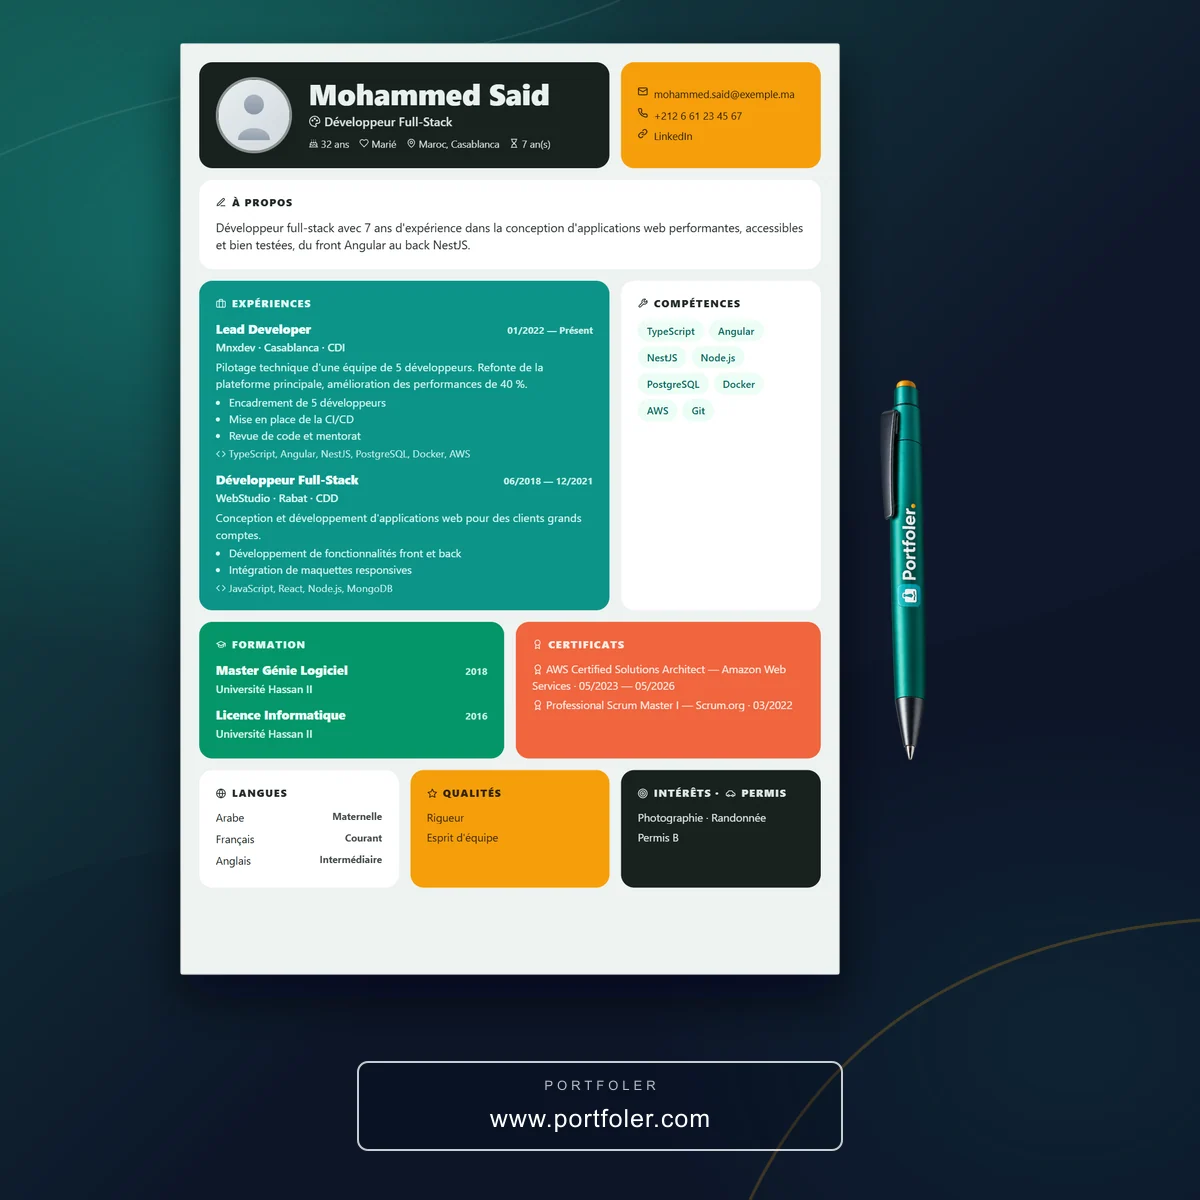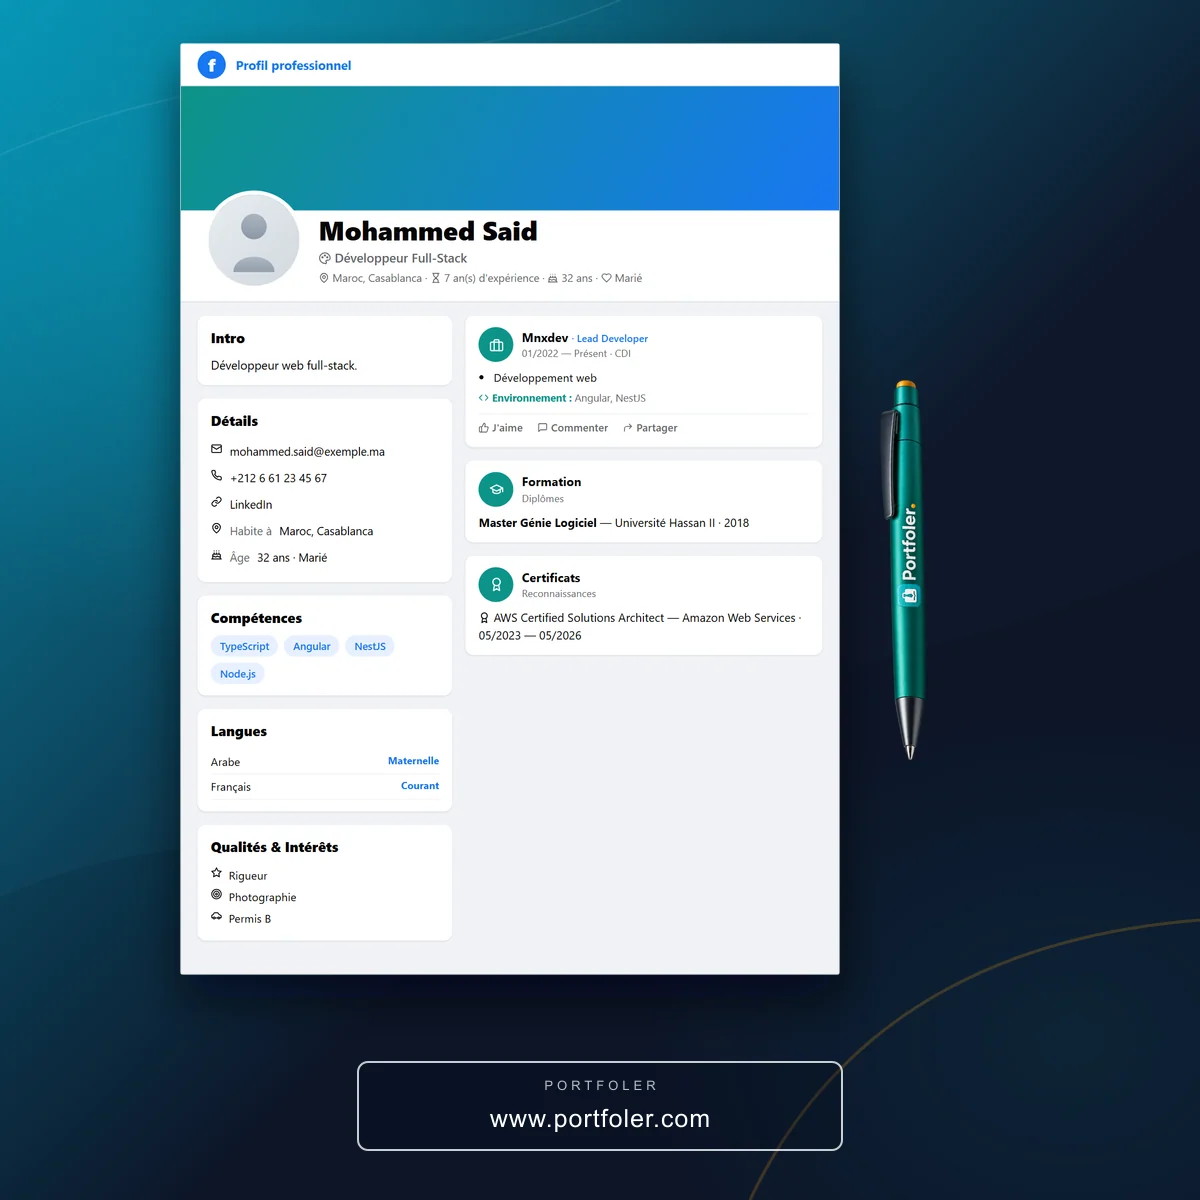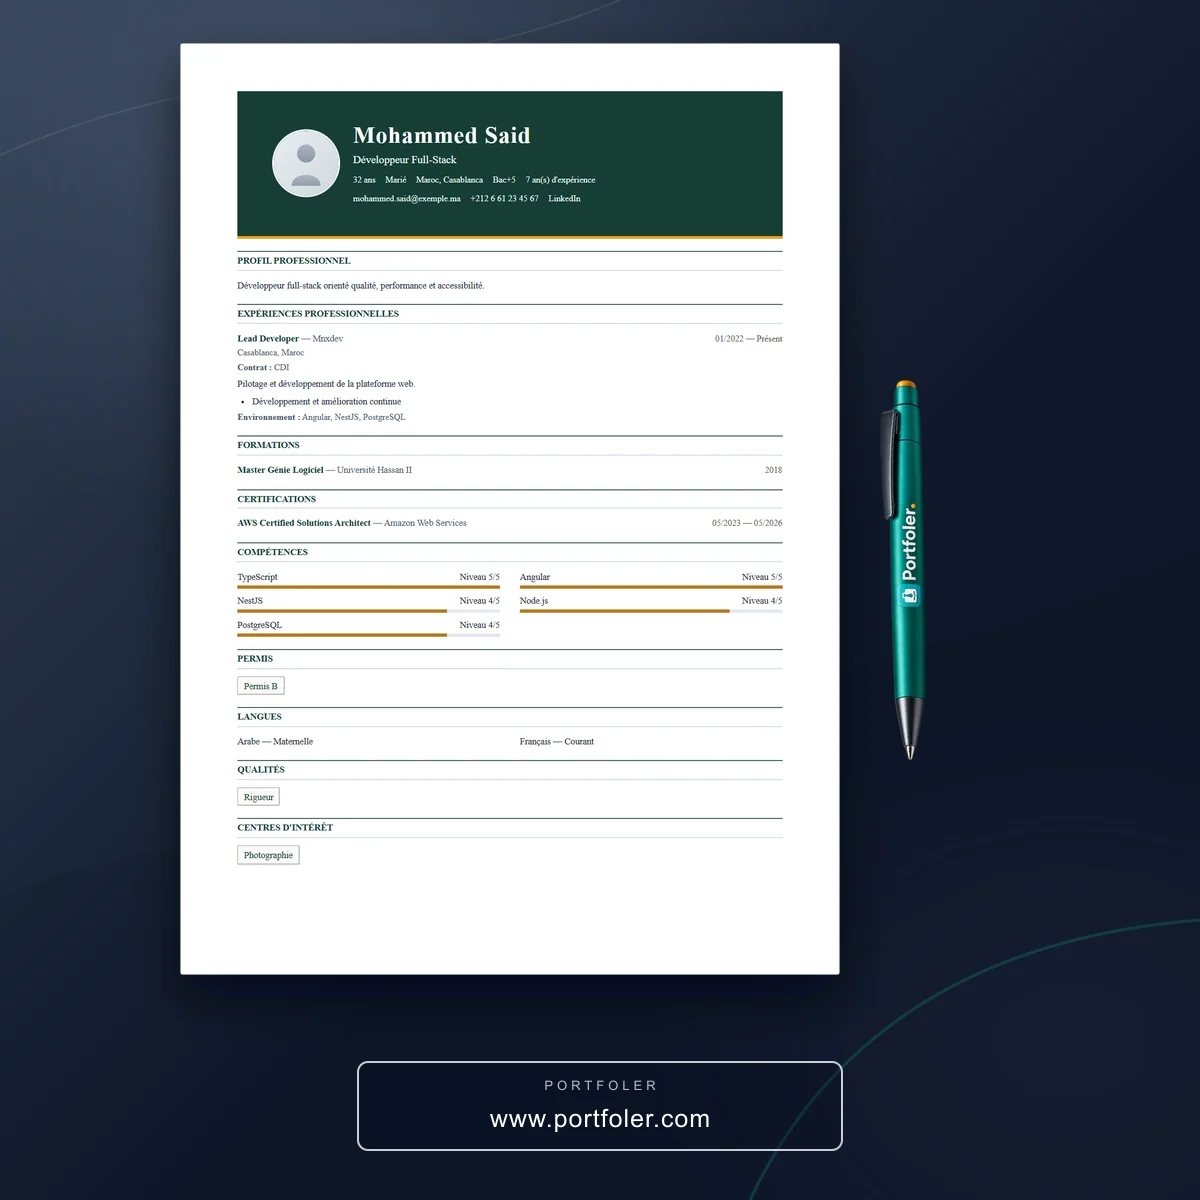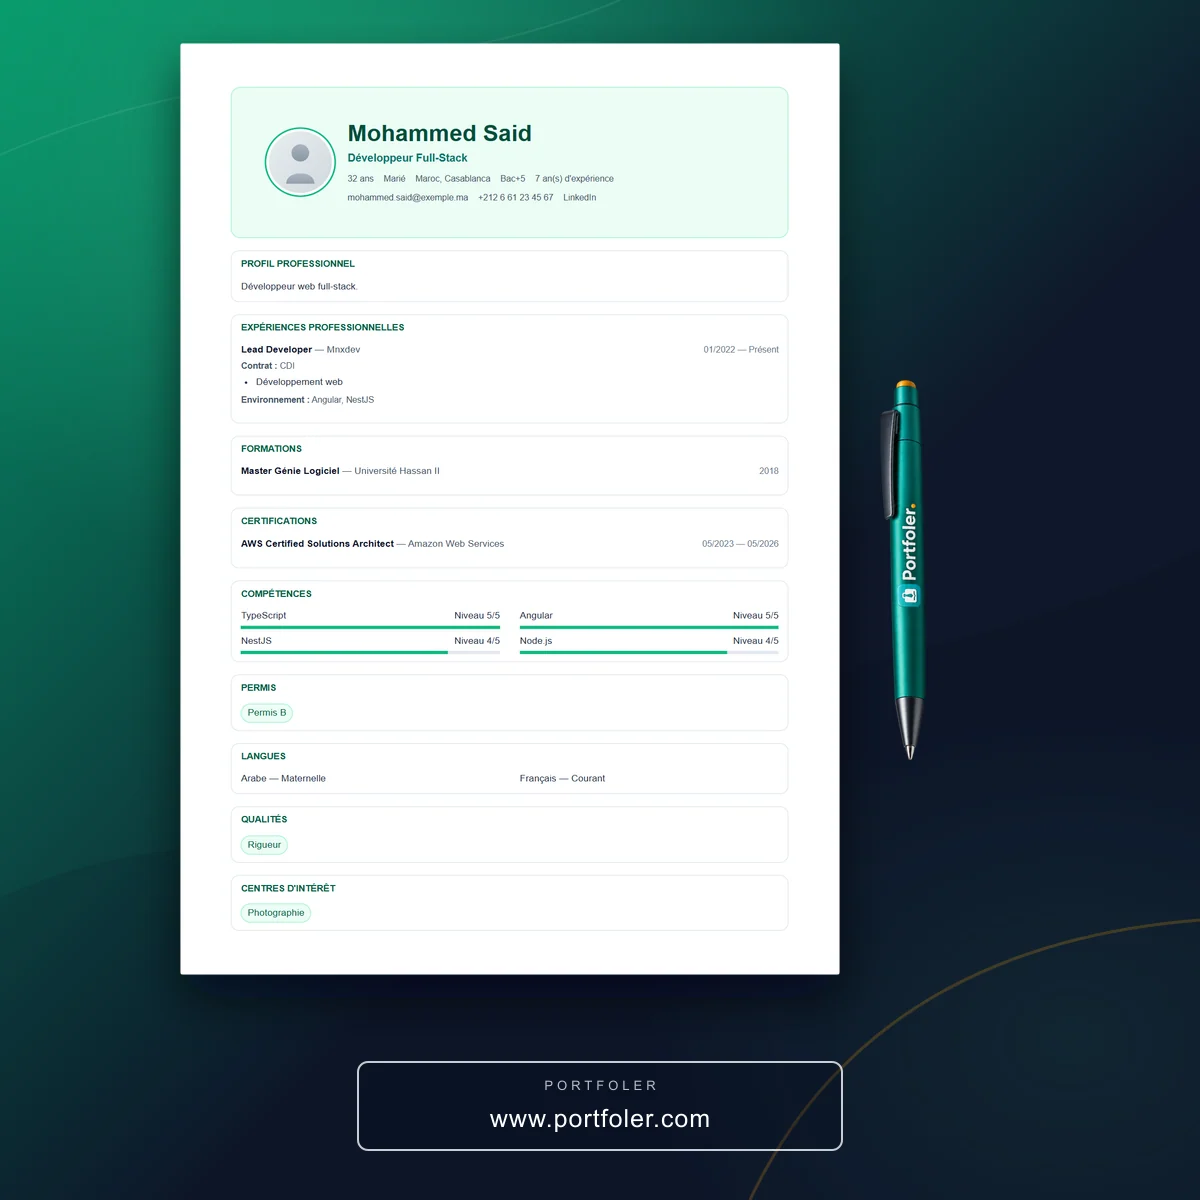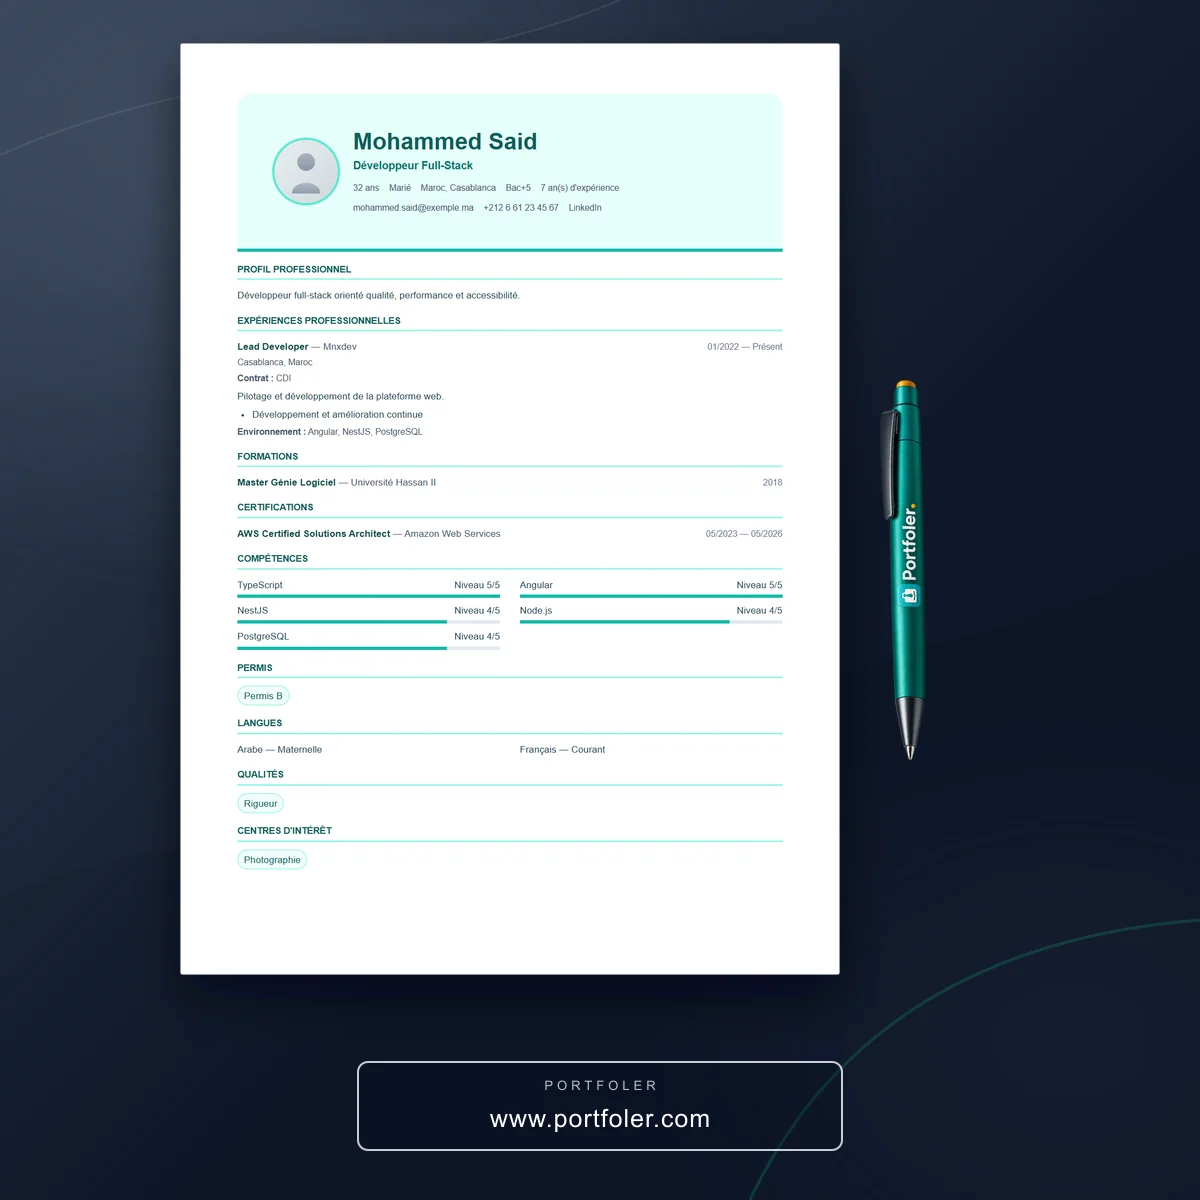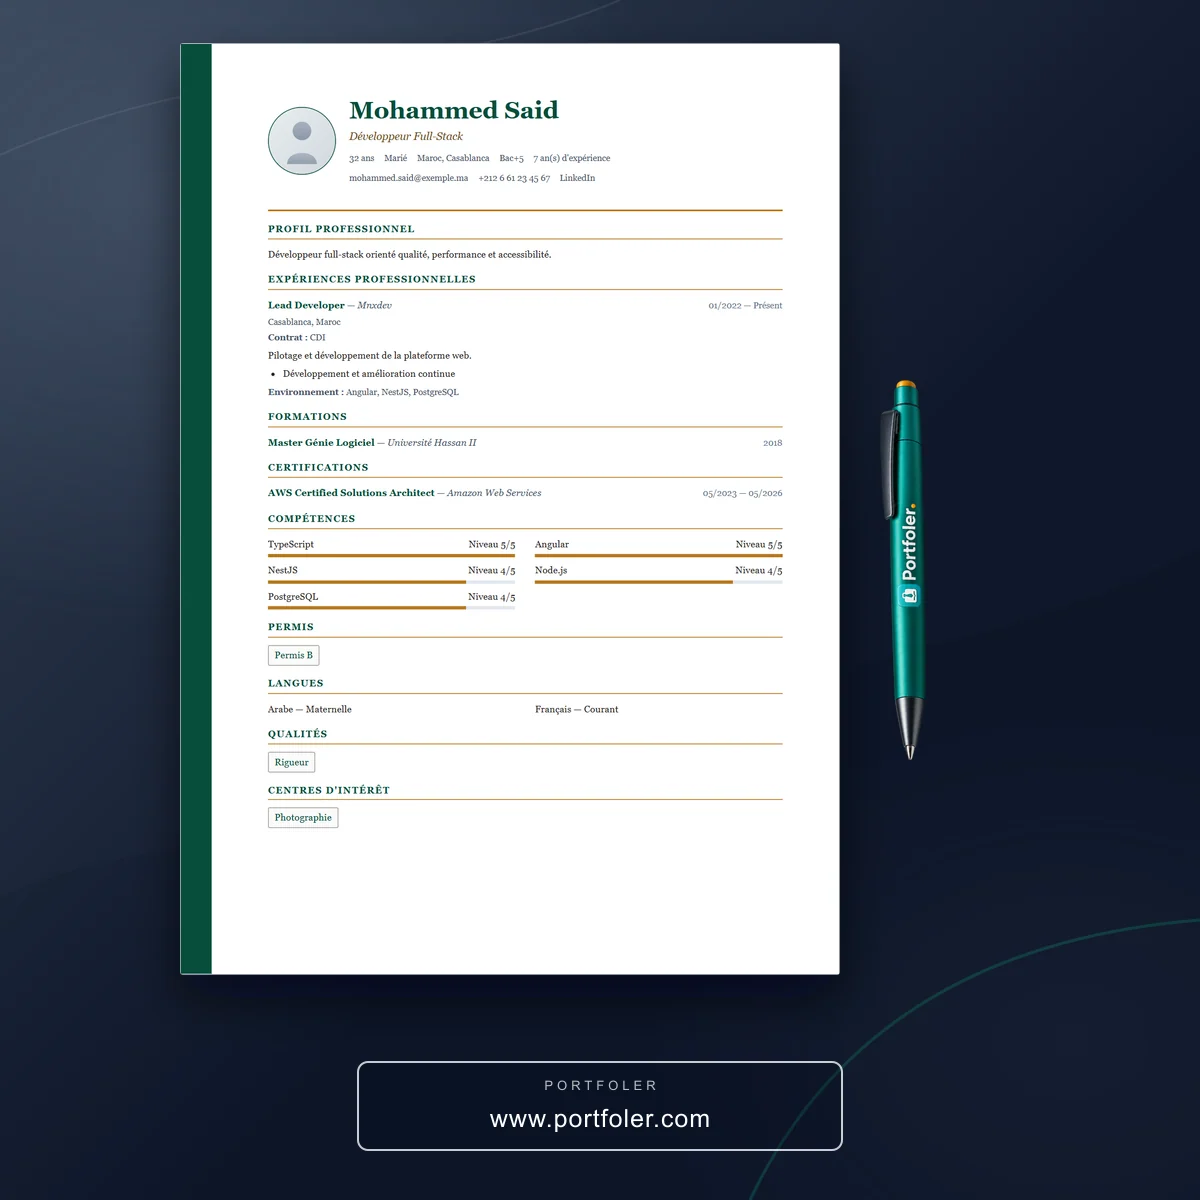
The Business Intelligence Analyst turns company data into dashboards and reports that drive decisions. At the crossroads of data and business, they query databases in SQL, model information and design visualizations that make performance readable for everyone. A highly sought-after data role, central to how organizations steer themselves.
Job description
The Business Intelligence Analyst (BI analyst) makes data usable for business teams. They collect, model and shape key indicators (KPIs) into clear, reliable and up-to-date dashboards, so that leaders and operational teams decide on facts rather than gut feeling.
Distinct from a data analyst — whose work is broader and more exploratory, with a statistical bent — and a data engineer — who builds the data pipelines —, the BI analyst focuses on reporting and visualization for decision-making. They bridge the databases and the concrete needs of the business.
Key responsibilities
- Gather business teams' needs and translate business questions into indicators.
- Query and join data in SQL from databases and the data warehouse.
- Model data (star schemas, measures, DAX calculations) for reliable reporting.
- Design interactive dashboards and reports (Power BI, Tableau, Looker).
- Define, document and track KPIs with stakeholders.
- Ensure the quality, consistency and freshness of the data displayed.
- Train users and spread a data-driven decision culture.
Required skills
Hard skills: SQL proficiency, data modeling and data warehousing, dashboard design (Power BI, Tableau, Looker), DAX and calculated measures, ETL basics, KPI definition, data preparation and cleaning, foundations of descriptive statistics.
Soft skills: business acumen, rigor and attention to detail, analytical and synthesis mindset, teaching ability and data storytelling, communication with business teams, curiosity and autonomy.
Salaries around the world
A Business Intelligence Analyst's pay varies widely from one country to another, depending on cost of living, the market's data maturity and how scarce the profile is. The salary-by-country table below shows indicative gross annual ranges, in local currency, for a junior-to-mid professional. Mastery of cloud tools, advanced DAX and modeling, along with the finance and tech sectors, pushes pay upward.
Career path
The role offers a clear progression, regardless of country:
- Junior analyst / Reporting analyst (0 – 2 years): producing reports, SQL queries, getting to grips with BI tools.
- Business Intelligence Analyst (2 – 5 years): ownership of a domain's dashboards, modeling and KPI definition.
- Senior BI Analyst / BI Developer (5 – 8 years): cross-cutting projects, reporting architecture, mentoring.
- BI Lead / Analytics Manager (8+ years): leading a data team, decision-support strategy — with pay well above mid-level ranges.
Remote work and international contracts also let many BI analysts access foreign salary scales from their country of residence.
Education & training
Several paths lead to the role, with no single route:
- A bachelor's to master's degree in computer science, statistics, data, engineering or business school.
- Transition from an adjacent role: management control, data analyst, developer, financial analyst.
- Tool certifications (Power BI, Tableau, SQL) that complement and validate hands-on experience.
The market values, above all, the ability to ship useful dashboards and to talk with the business.
Opportunities and sectors
Business Intelligence Analysts are recruited across every data-driven sector: banking and finance, e-commerce and retail, manufacturing, healthcare, telecoms, SaaS vendors, energy and large enterprises undergoing transformation. The spread of data cultures and cloud warehouses makes this a durably in-demand profile, with strong prospects toward analytics engineering or data management.
In summary
A concrete, cross-cutting and highly in-demand data role at the heart of performance steering. If you turn raw data into informed decisions, create your profile on Portfoler.com and attract the projects and recruiters that match your ambitions.
 United States
 United Kingdom
 Germany
 France
 Canada
 United Arab Emirates
 Morocco
 India
 Spain
 Australia
 Netherlands
 Brazil